Feature Walkthrough
WhyLabs Observe provides full AI lifecycle observability for insights into your data and model health, alerting you to drift events, performance degradations, potential attacks, and model behavior changes. All model types including large language models (LLMs) are supported, as are all data types including structured, unstructured, and streaming data.
This page provides a walkthrough of the platform features available in WhyLabs Observe.
Project Dashboard
The Project Dashboard is the jumping-off point for many of the features available in the WhyLabs AI Control Center. The Project Dashboard serves as a centralized location offering observability into all of your models and datasets within a custom date range.
Navigation, date ranges, and page-level controls
On the Project Dashboard—and on all other pages—the dark header contains controls that set the overall scope of the current dashboard. Beneath the dark header is the page-level control area. These controls are specific to the current page, although some controls are shared across all pages. See below for a breakdown of the header and page-level controls:
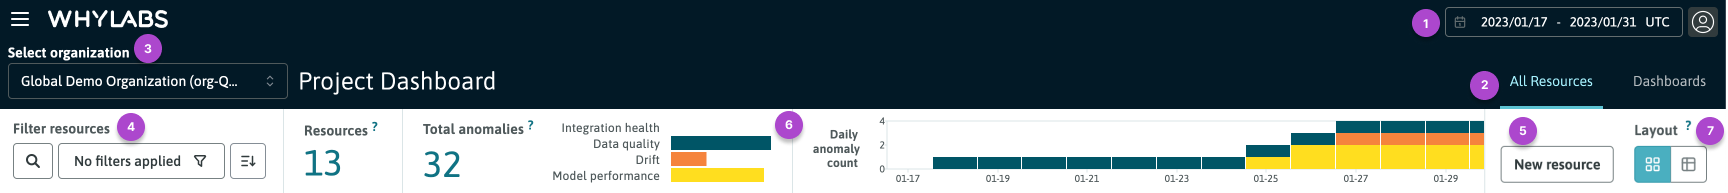 WhyLabs header and page level controls
The header controls are:
- The global date range selector, located in the top right corner of the header
- Tabs for switching between the "All Resources" and "Dashboards" views, positioned under the date range selector
- For teams with more than one organization, the org selector is located on the left of the header, under the WhyLabs logo
The page-level controls for the Project Dashboard are:
- Filters to refine the list of resources displayed on the page based on their tags or model type (LLM, classification, regression, ranking etc.), or dataset type (source, stream, transform, etc.)
- A button shortcut to set up a new resource
- An anomaly summary widget that shows the total number of anomalies detected across all resources in the organization
- A layout toggle button to switch between the dashboard and between card (default) view and table view
The Project Dashboard is separated into two views by tabs as follows:
- The default "All Resources" view, and
- The "Dashboards" tab where org-level summary dashboards are located, such as model summaries and custom dashboards
All Resources View
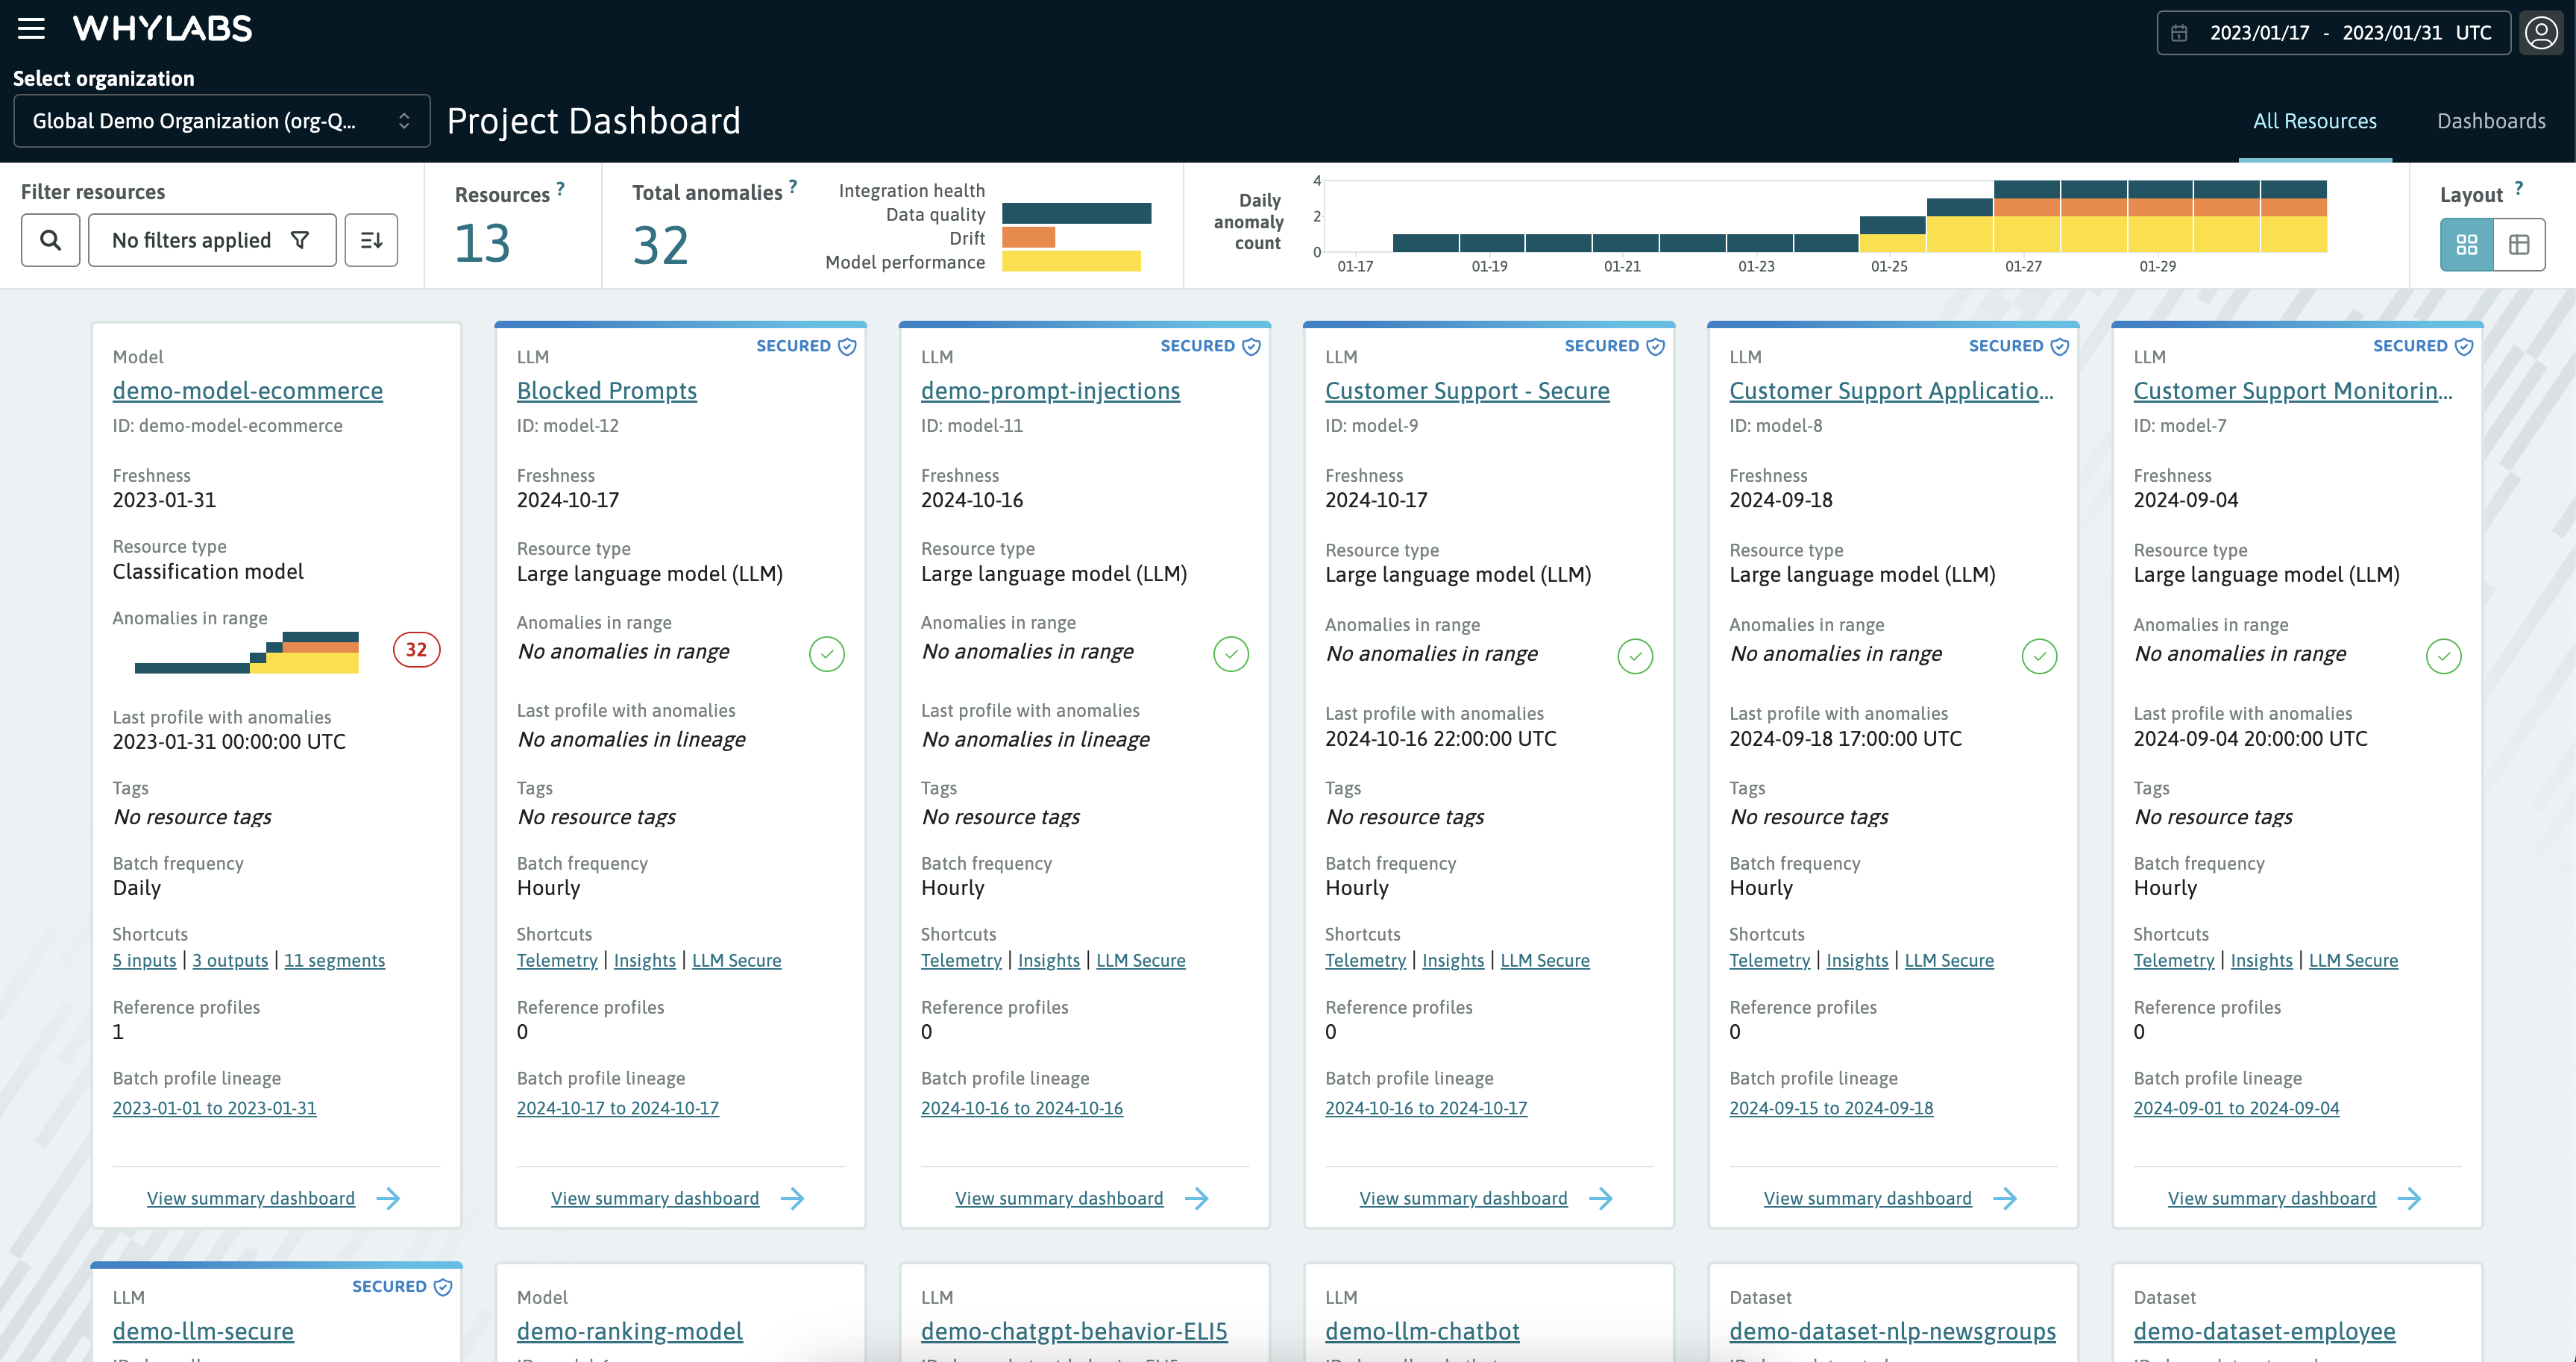 The Project Dashboard showing the "All Resources" view
The All Resources view contains a list of all resources in the organization, with shortcuts to the individual resource dashboards. The following information is displayed for each resource:
- Resource type (model, dataset or LLM)
- Resource name: the name of the model or dataset
- Freshness: the date of the last uploaded profile to the resource
- Resource subtype (For example: regression, classification or large language models; source, stream or transform datasets)
- Global and resource-specific anomaly summary by day
- Anomalies in range: the global distribution of anomalies by type (data quality, drift, performance, etc.)
- The last profile detected with anomalies (which may not be within the selected date range)
- Tags applied to the resource
- The number of reference profiles uploaded for the resource
- Profile lineage for each resource, show the historical lineage of profiles uploaded to the resource
It's possible to sort the order of the resources on the Project Dashboard. To do this, use the sort menu that can be accessed by clicking the button located to the right of the "Filter Resources" widget, or change to table view by clicking the layout toggle button. Then, use the table's column sorting function to sort resources as needed.
Filtering the Project Dashboard
You can filter the Project Dashboard on different attributes:
- Model type (LLM, classification, regression, ranking, etc.)
- Dataset type (source, stream, transform, etc.)
- Resource tags (e.g. "ENV:dev", "OwnedByBob")
The filter widget supports "composite filtering" which allows you to filter on multiple attributes at once. For example, you can filter for all LLMs tagged as "ENV:dev" and "OwnedByBob". Adding multiple options to a filter clause is handled with OR boolean logic, while adding a new filter clause performs AND boolean logic.
In the following example we are filtering resources with model type LLM AND tagged as "ENV:dev" OR "OwnedByBob"
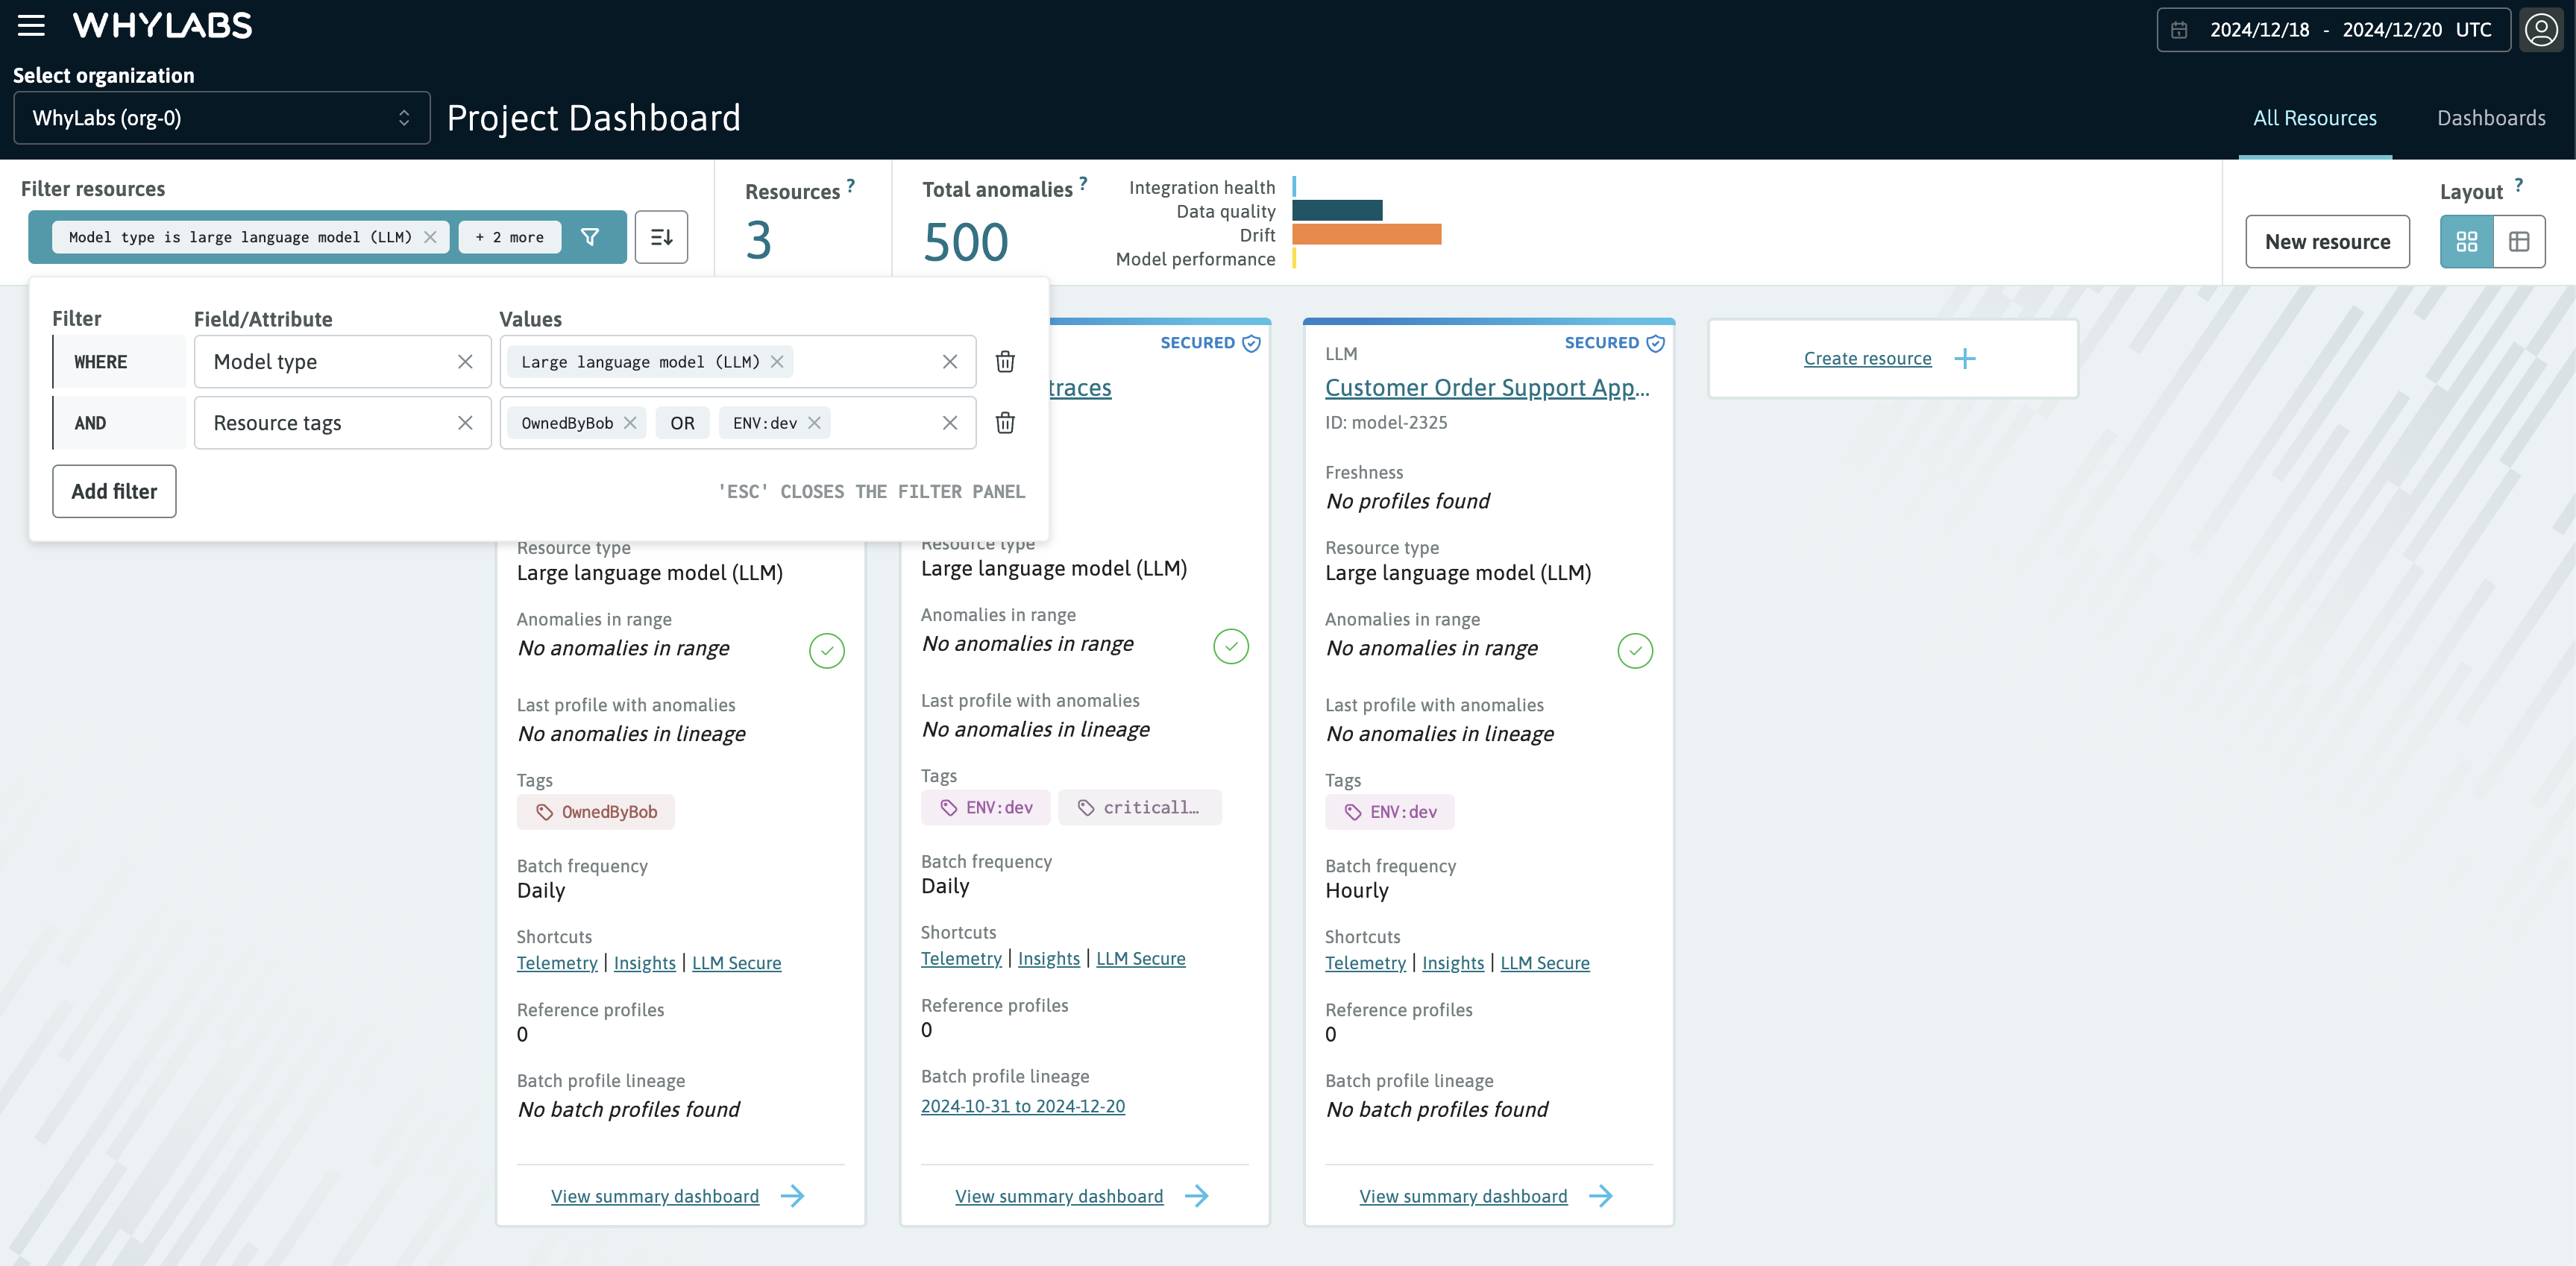 Showing the resources filter with model type and tags filter selected
Additional information and documentation on the creation and usage of tags for resources can be found on the Resource tags section.
Overall Summary Dashboards
From the Project Dashboard click on the "Dashboards" tab located on the right side of the WhyLabs header. This tab lets you access two types of dashboard views that have org-wide scope:
1. Overall summary dashboards for models and datasets
These dashboards display aggregate metrics to summarize total resources, monitoring coverage, total inferences, data volume, total anomaly counts, and more. They provide a snapshot of operational heath for all resources in the organization, and can be useful for ops health reports at business review meetings.
There are two org-level summary dashboards in WhyLabs Observe:
Additional information on these dashboards can be found on the Dashboard Overview page.
2. Custom dashboards
Custom dashboards are managed in the "My Dashboards" tab, which is the default view when clicking on the "Dashboards" tab. These user-defined dashboards can be created and saved for specific use cases not covered by the default dashboards. They can be created by any user with the correct permissions, and are viewable by all users that have access to the organization.
Additional information and documentation on these dashboards can be found on the Custom Dashboards page.
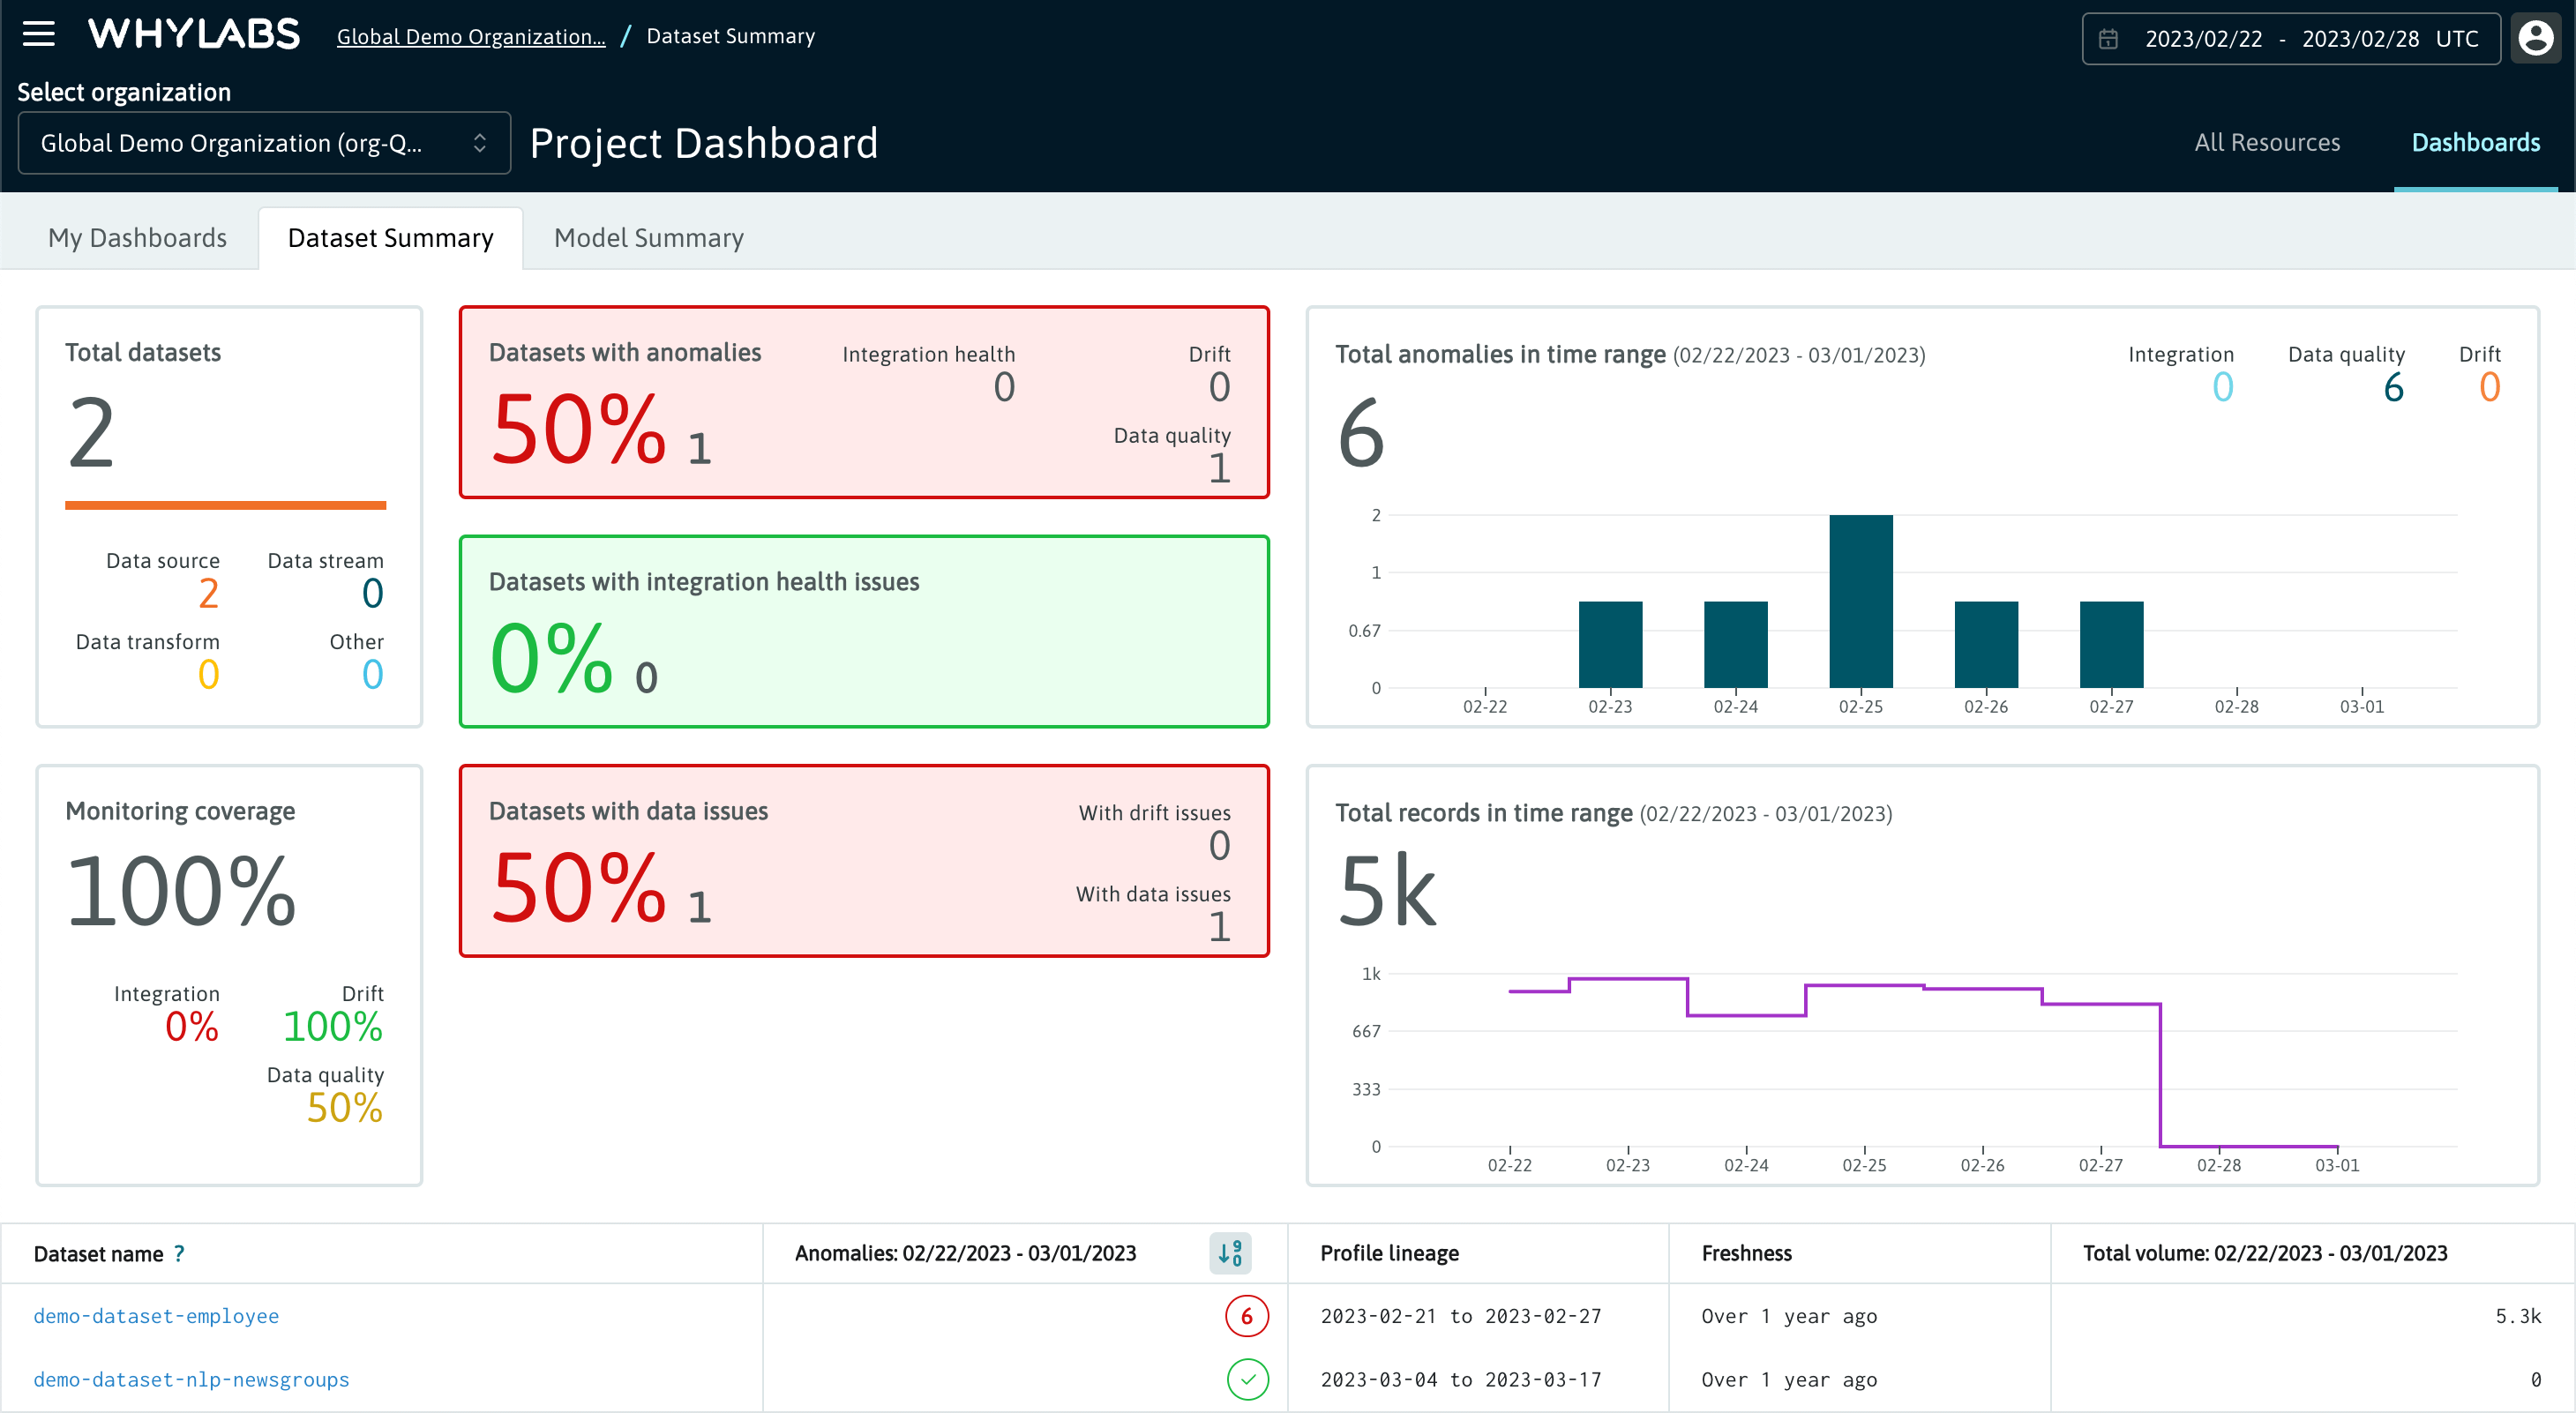
Dataset Summary
The Datasets Summary tab contains:
- Total dataset count with a breakdown by subtype
- Monitoring coverage across all datasets
- Total anomaly count across all datasets within the time range, with a breakdown by category
- Total record count across all datasets within the time range
- A table summary of all datasets, including their anomaly distribution, volume, lineage and freshness
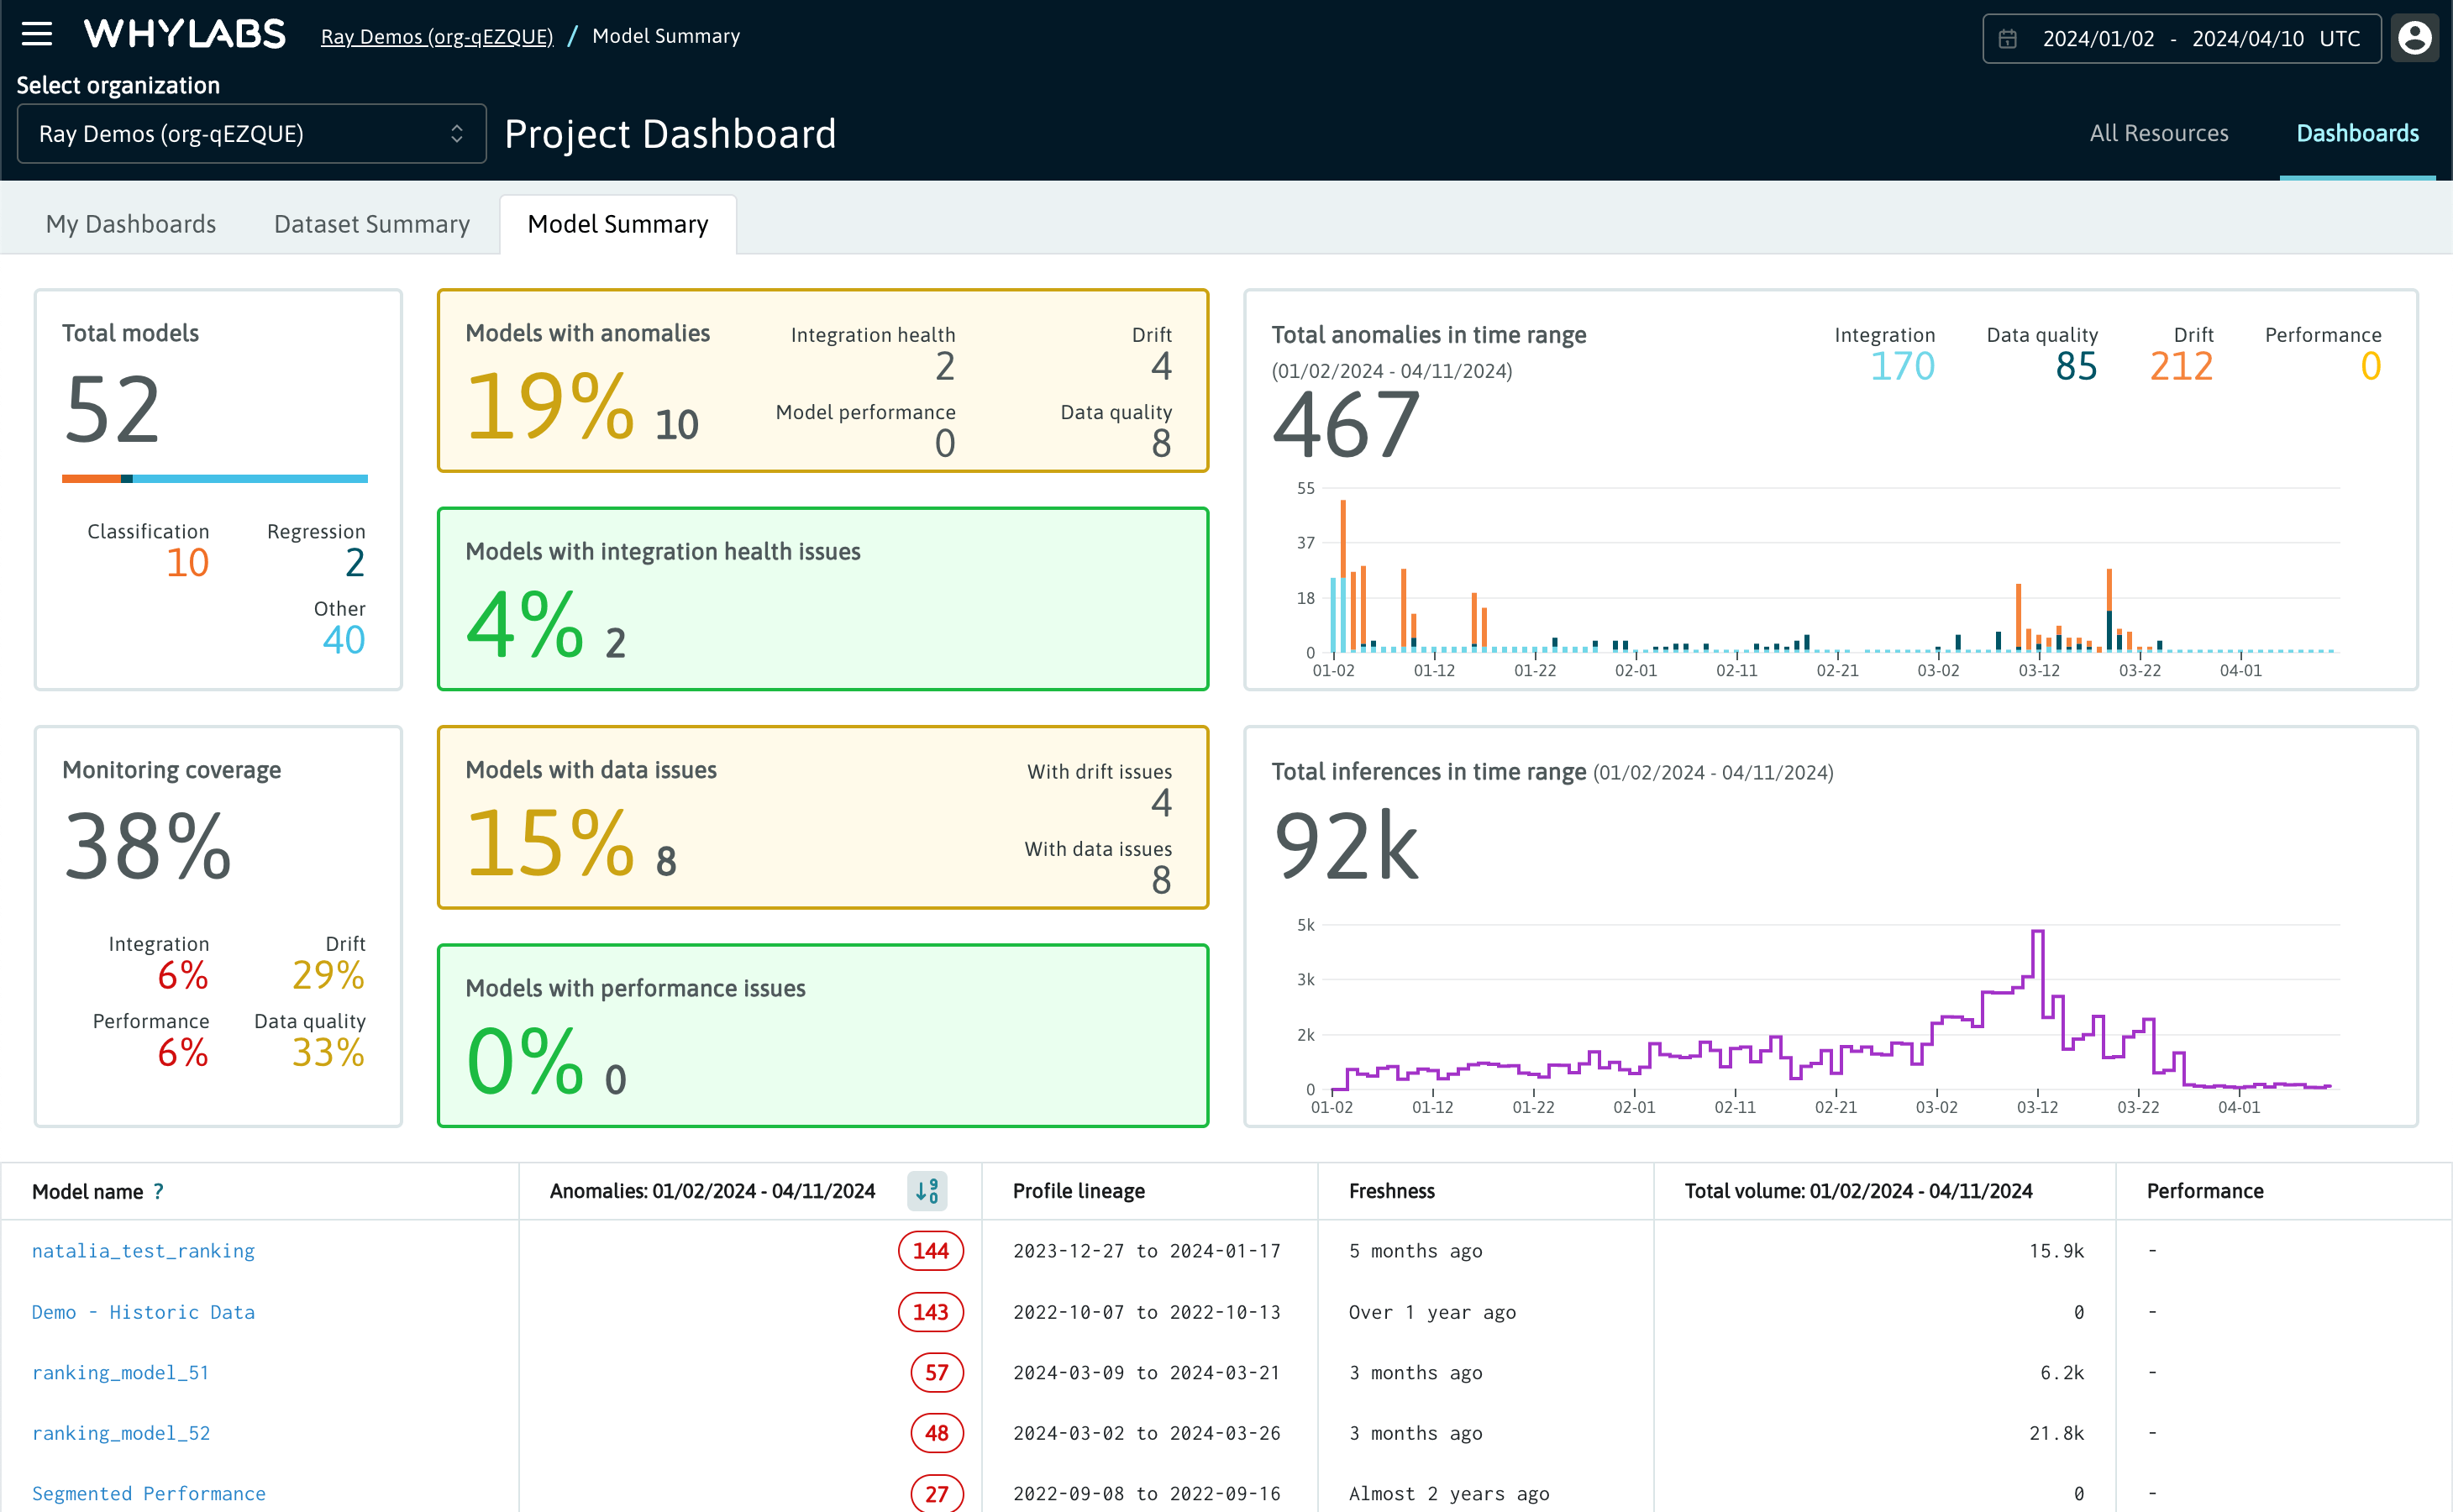
Model Summary
The Models Summary tab contains:
- Total model count with a breakdown by subtype
- Monitoring coverage across all models
- Total anomaly count across all models within the time range, with a breakdown by category including performance
- Total inference count across all models within the time range
- A table summary of all models, including their anomaly distribution, inference volume, and lineage
Custom Dashboards
Please refer to the detailed overview of custom dashboards on this page.
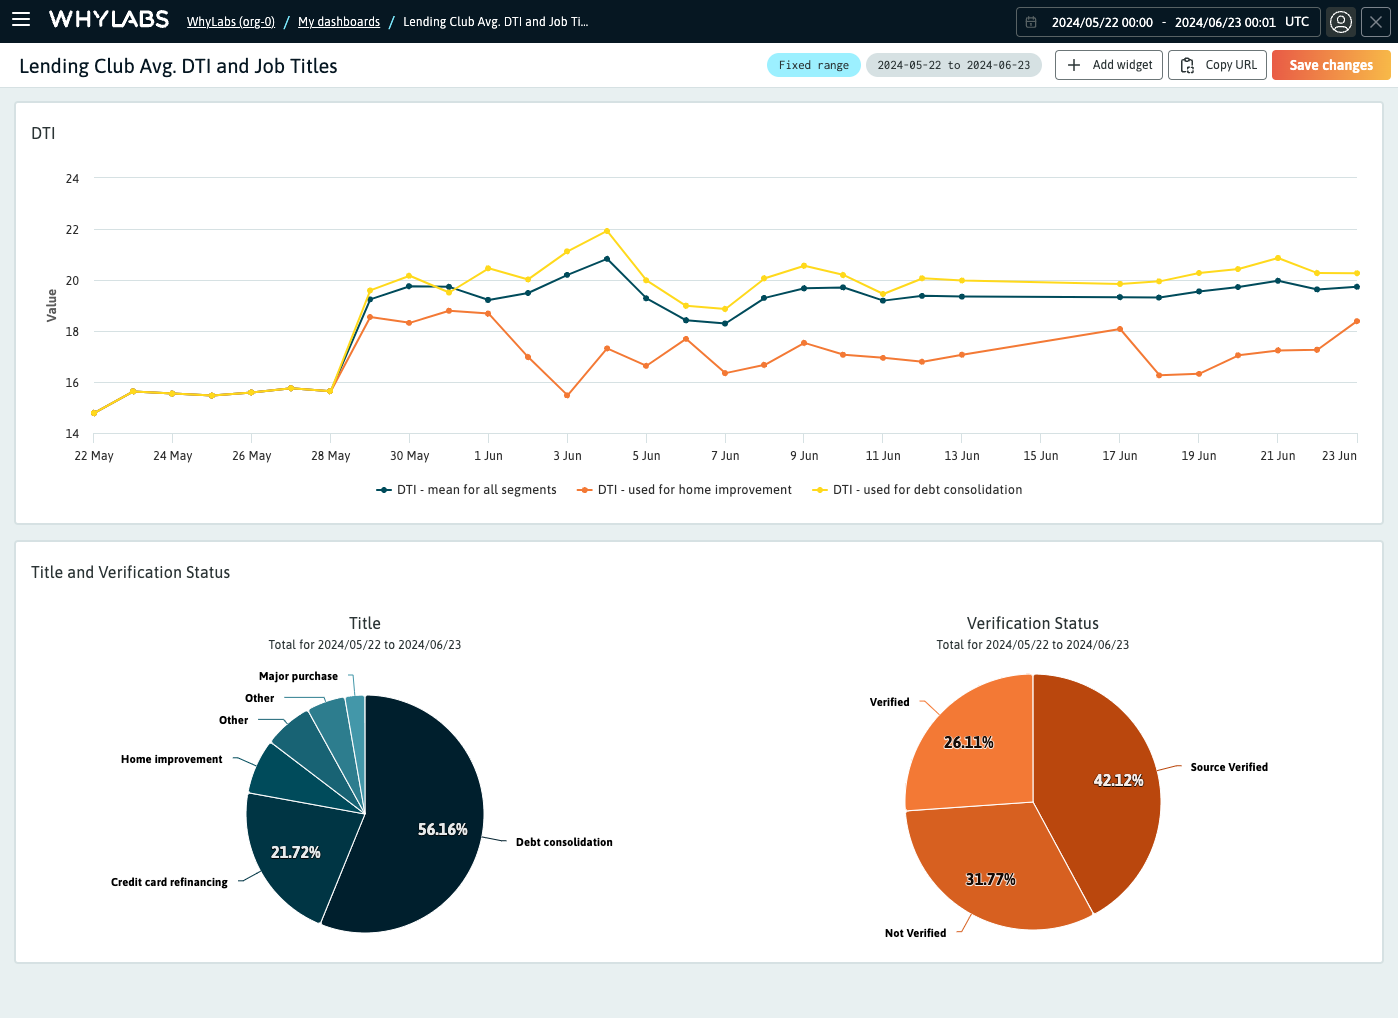 The "My dashboards" page showing a list of custom dashboards in an organization
Single Resource Dashboards
Resource Summary
When clicking into a resource from the Project Dashboard, the "Summary" tab shows users various metrics specific to that resource (model or dataset) for profiles within the selected date range.
For a Dataset, the summary cards include:
- Profile count and date range
- Monitoring coverage - which categories of monitoring are covered or not
- Integration health - whether profiles have been uploaded recently
- Columns health - summary of changes in data volume and anomaly volume
- Segments - count of segments and changes in their anomaly volume
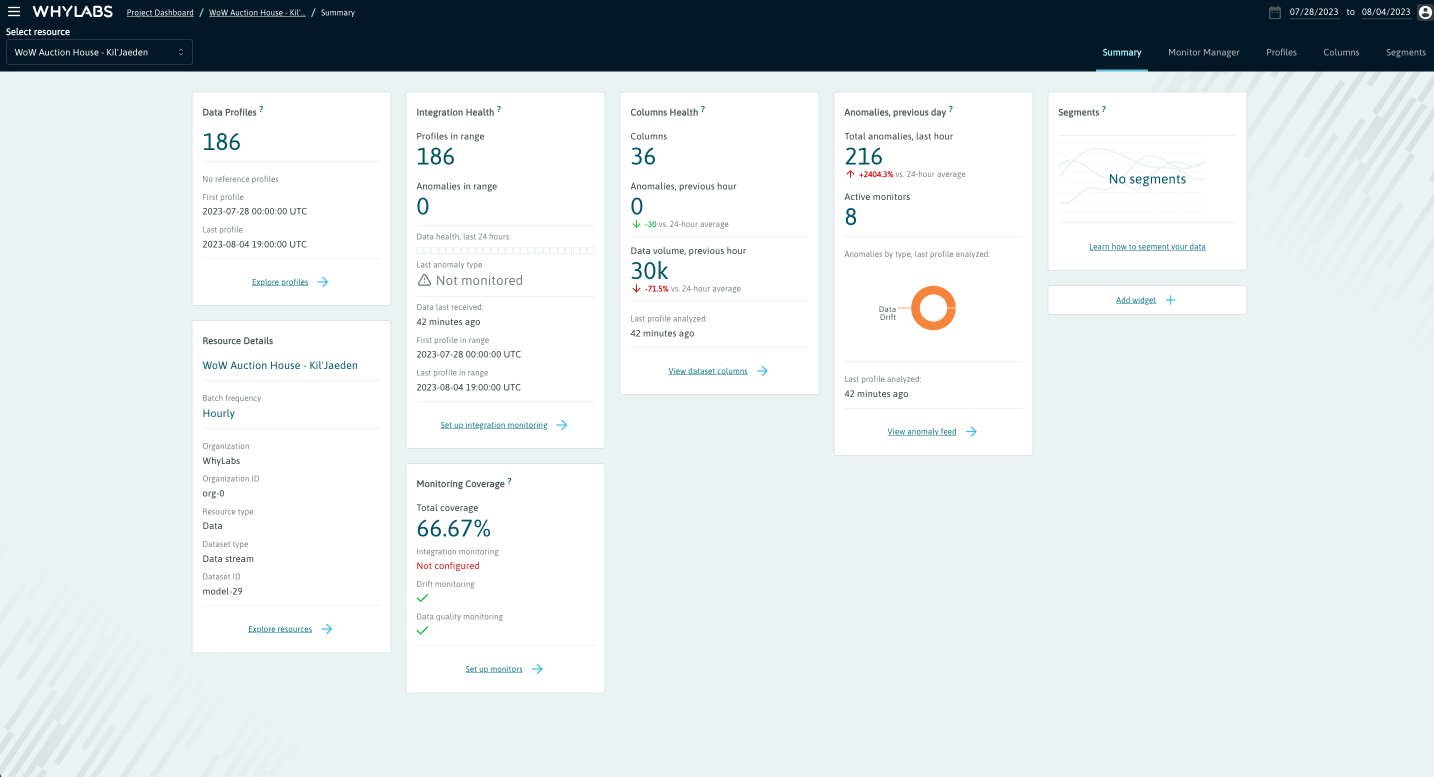 Individual dataset summary view
For a Model, the summary cards include:
- Profile count and date range
- Monitoring coverage - which categories of monitoring are covered or not
- Integration health - whether profiles have been uploaded recently
- Input and Output health - summary of changes in data volume and anomaly volume
- Model performance - summary of model performance metrics
- Segments - count of segments and changes in their anomaly volume
- Explainability information
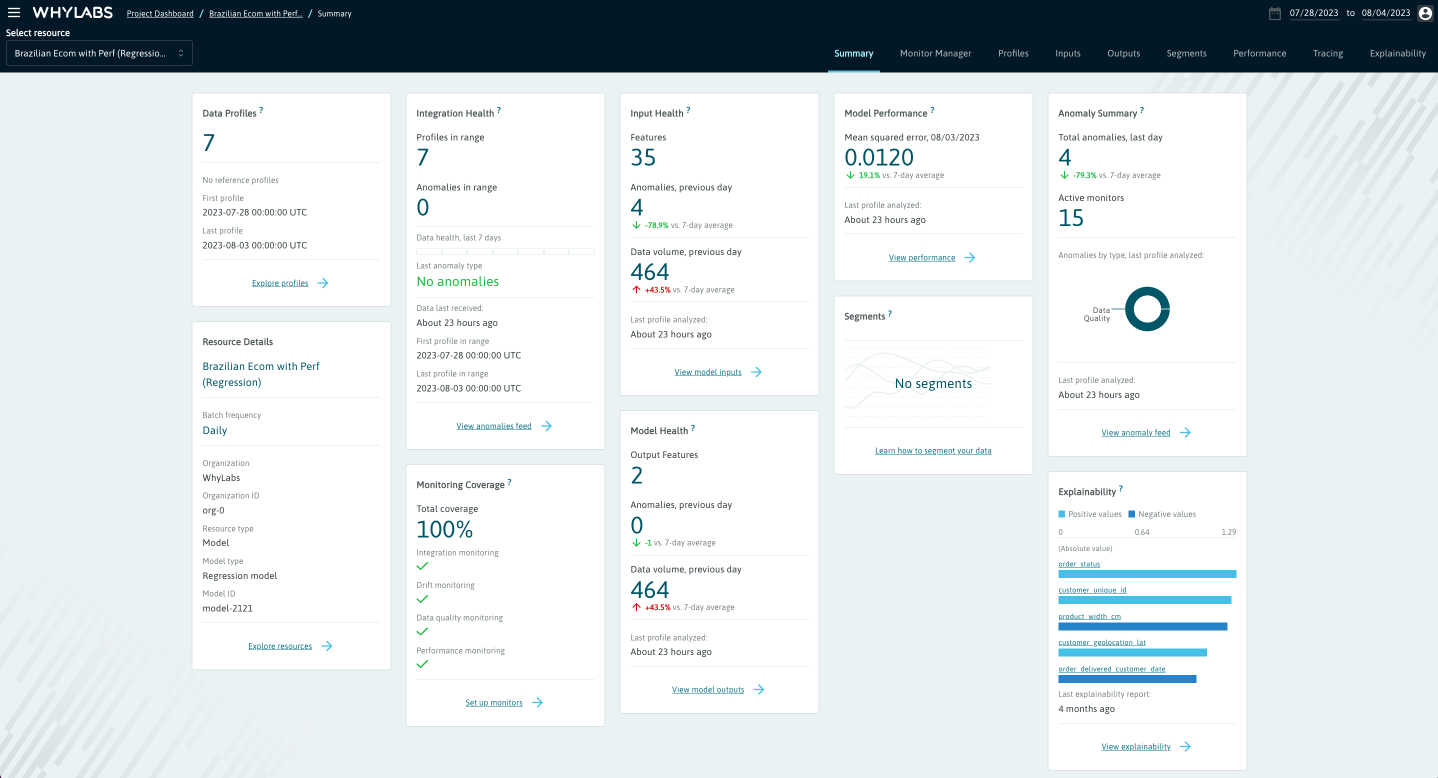 Individual model summary view
Profiles
The "Profiles" tab allows users to compare up to three batch profiles which belong to a specific resource. You can learn more about profiles here. From this page users can:
- Compare multiple uploaded profiles directly
- Compare distributions from multiple profiles directly for any column
- Compare statistics for specific profiles
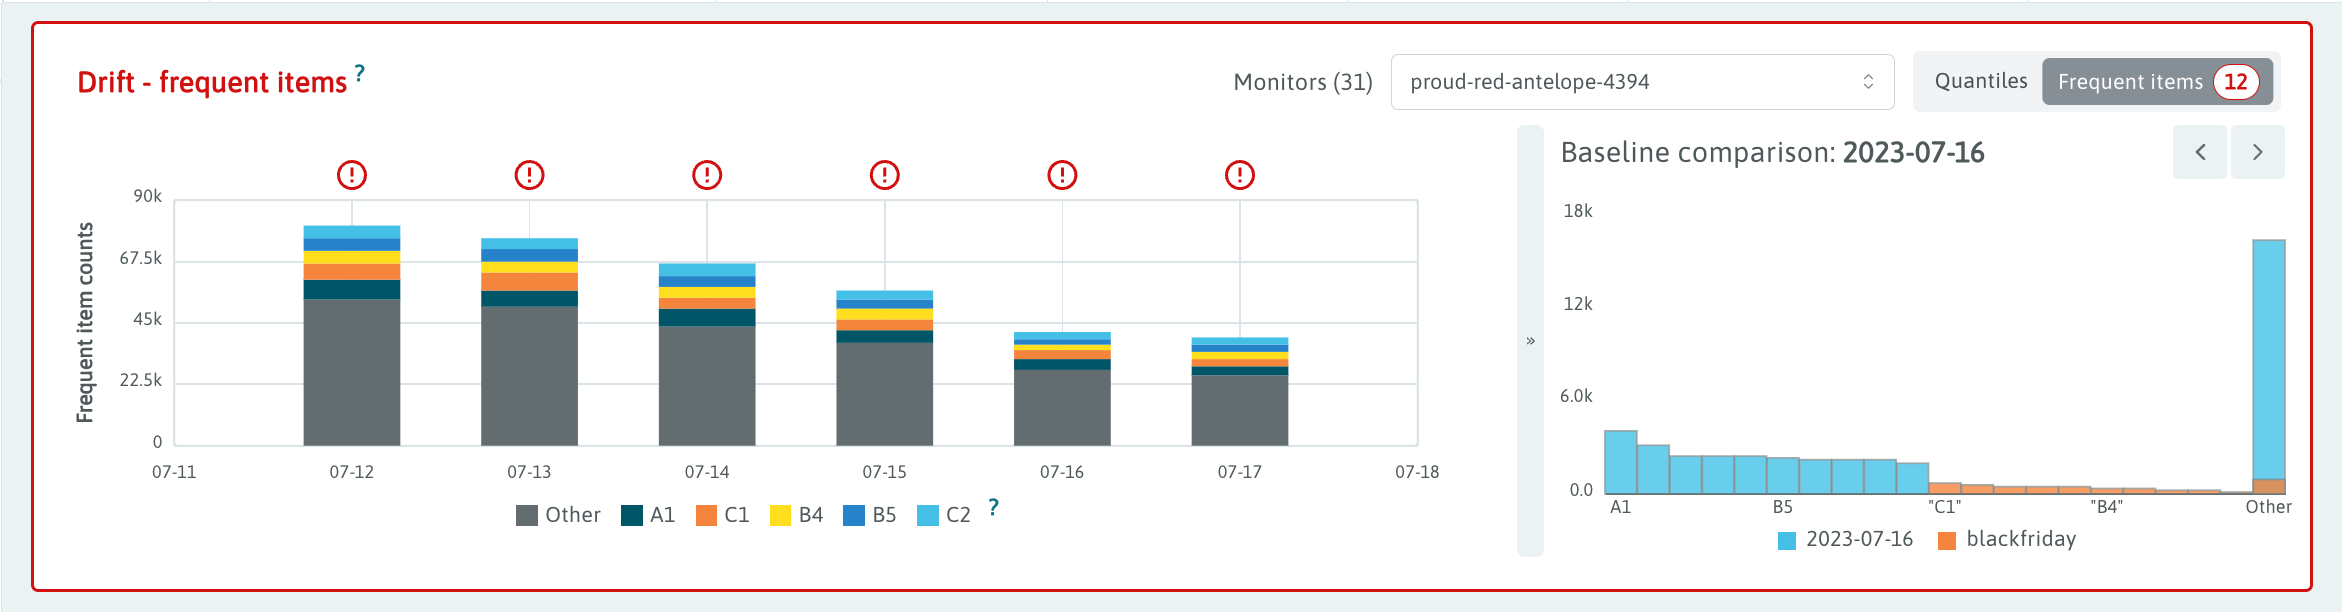
- Compare most frequent items from two profiles
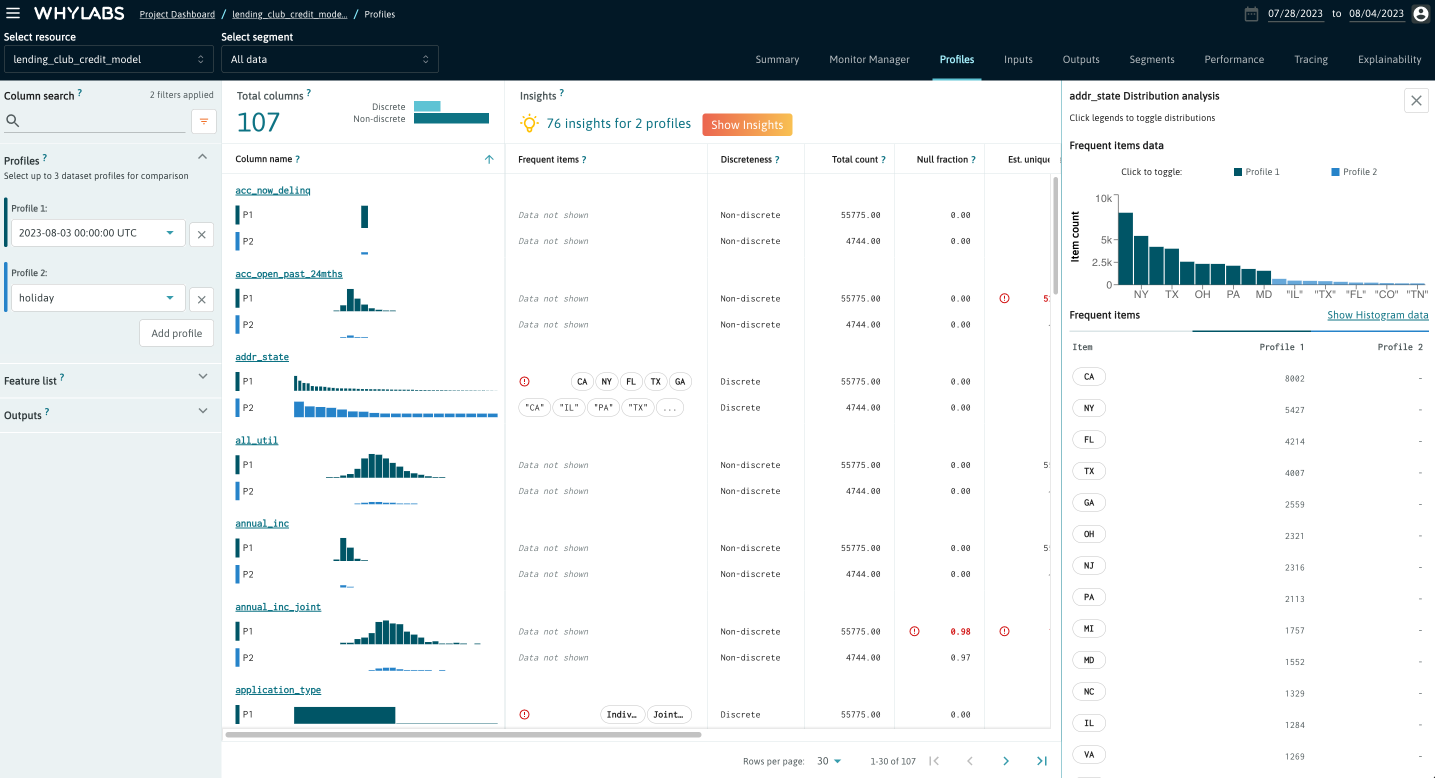
By clicking on the "Insights" button, users can see a list of observations about the selected profiles which may help uncover unexpected conditions in the data.
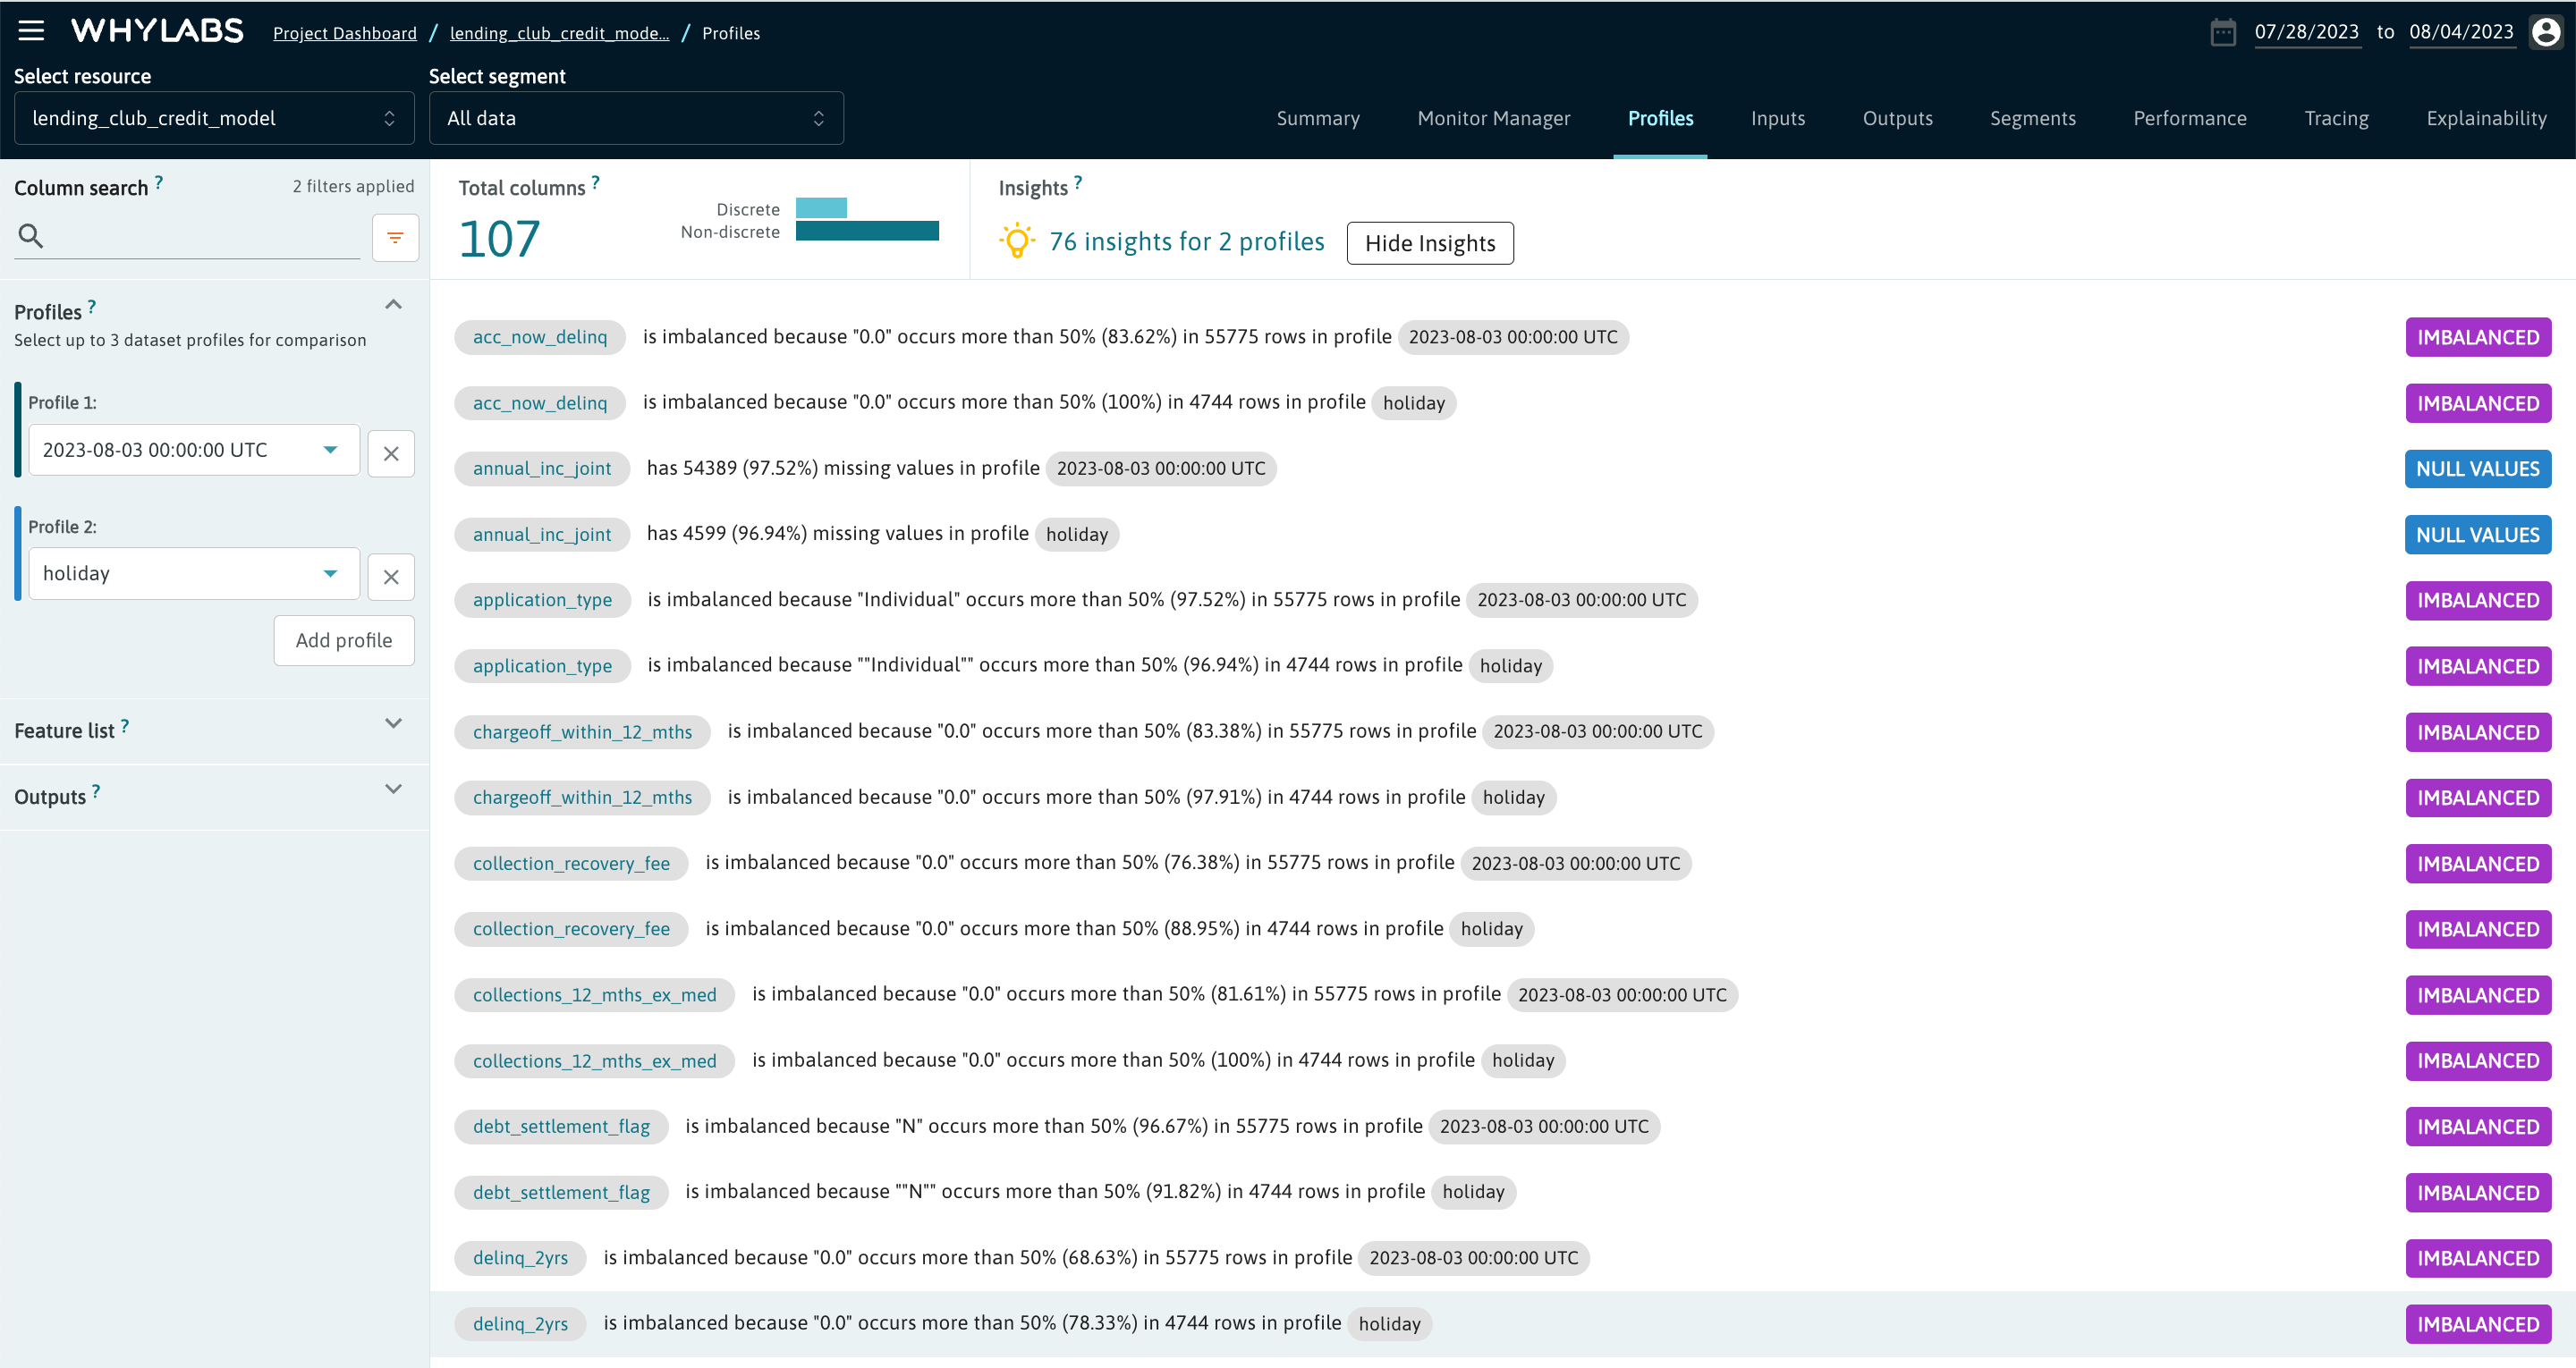
See Profiles for more guidance on working with profiles.
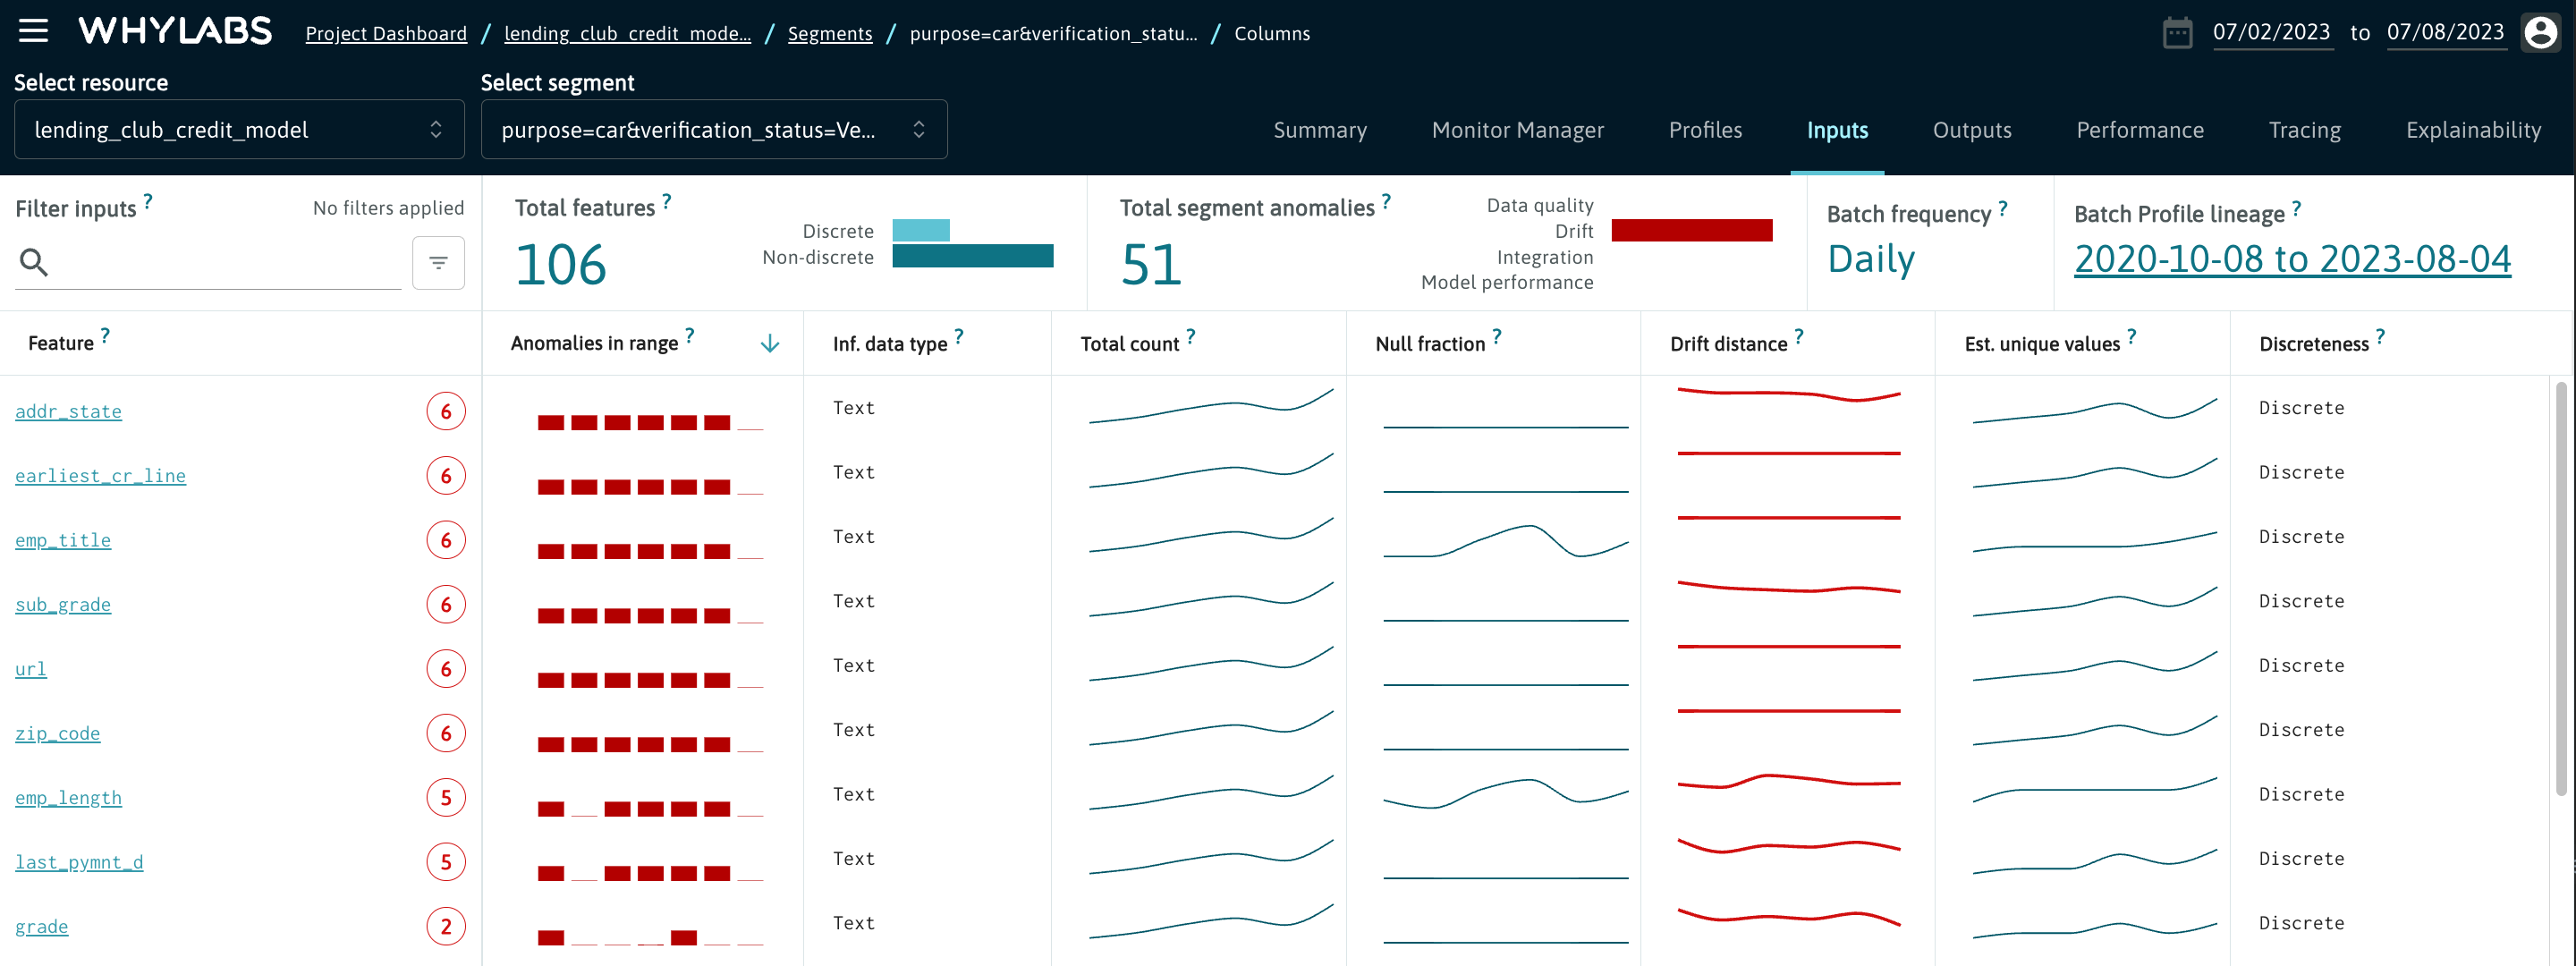
Inputs, Outputs and Columns
The "Inputs" and "Outputs" tabs for Models and the "Columns" tab for Datasets provide a view of the anomalies by column through the selected time range for various monitored metrics. These metrics include:
- Inferred data type
- Total count
- Null fraction
- Drift distance
- Estimated unique values
- Discreteness
- Data type count
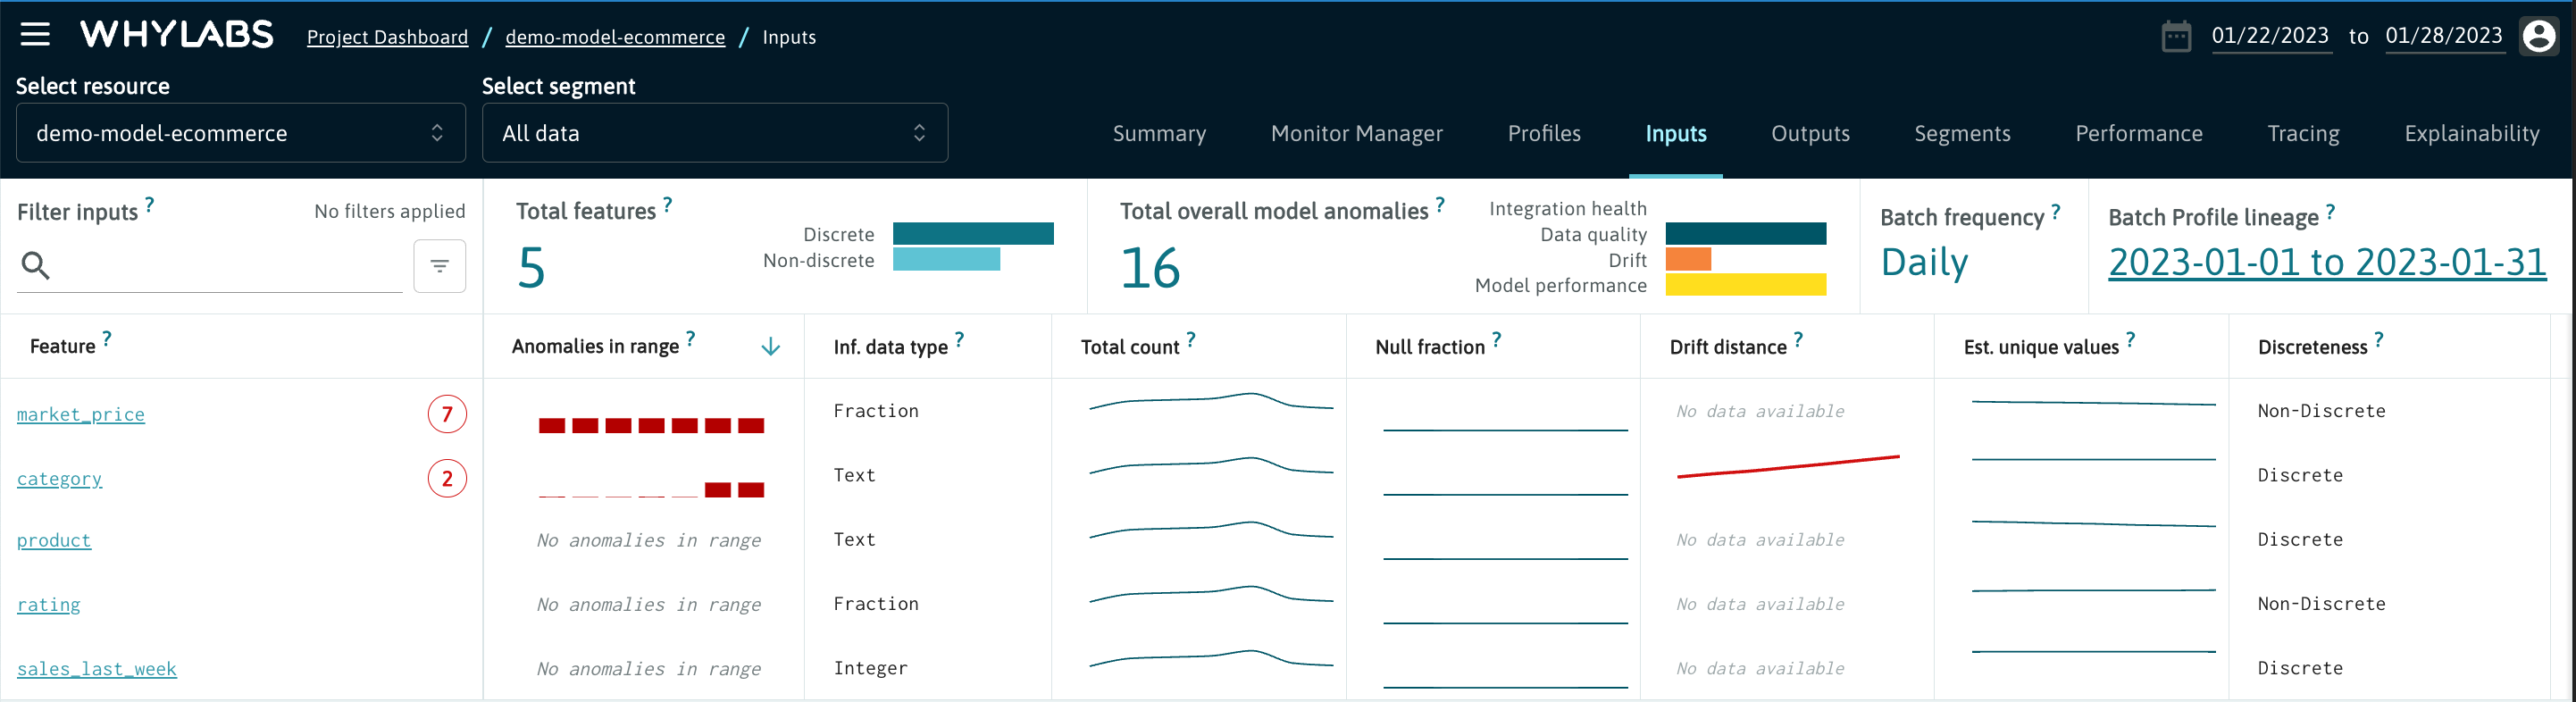
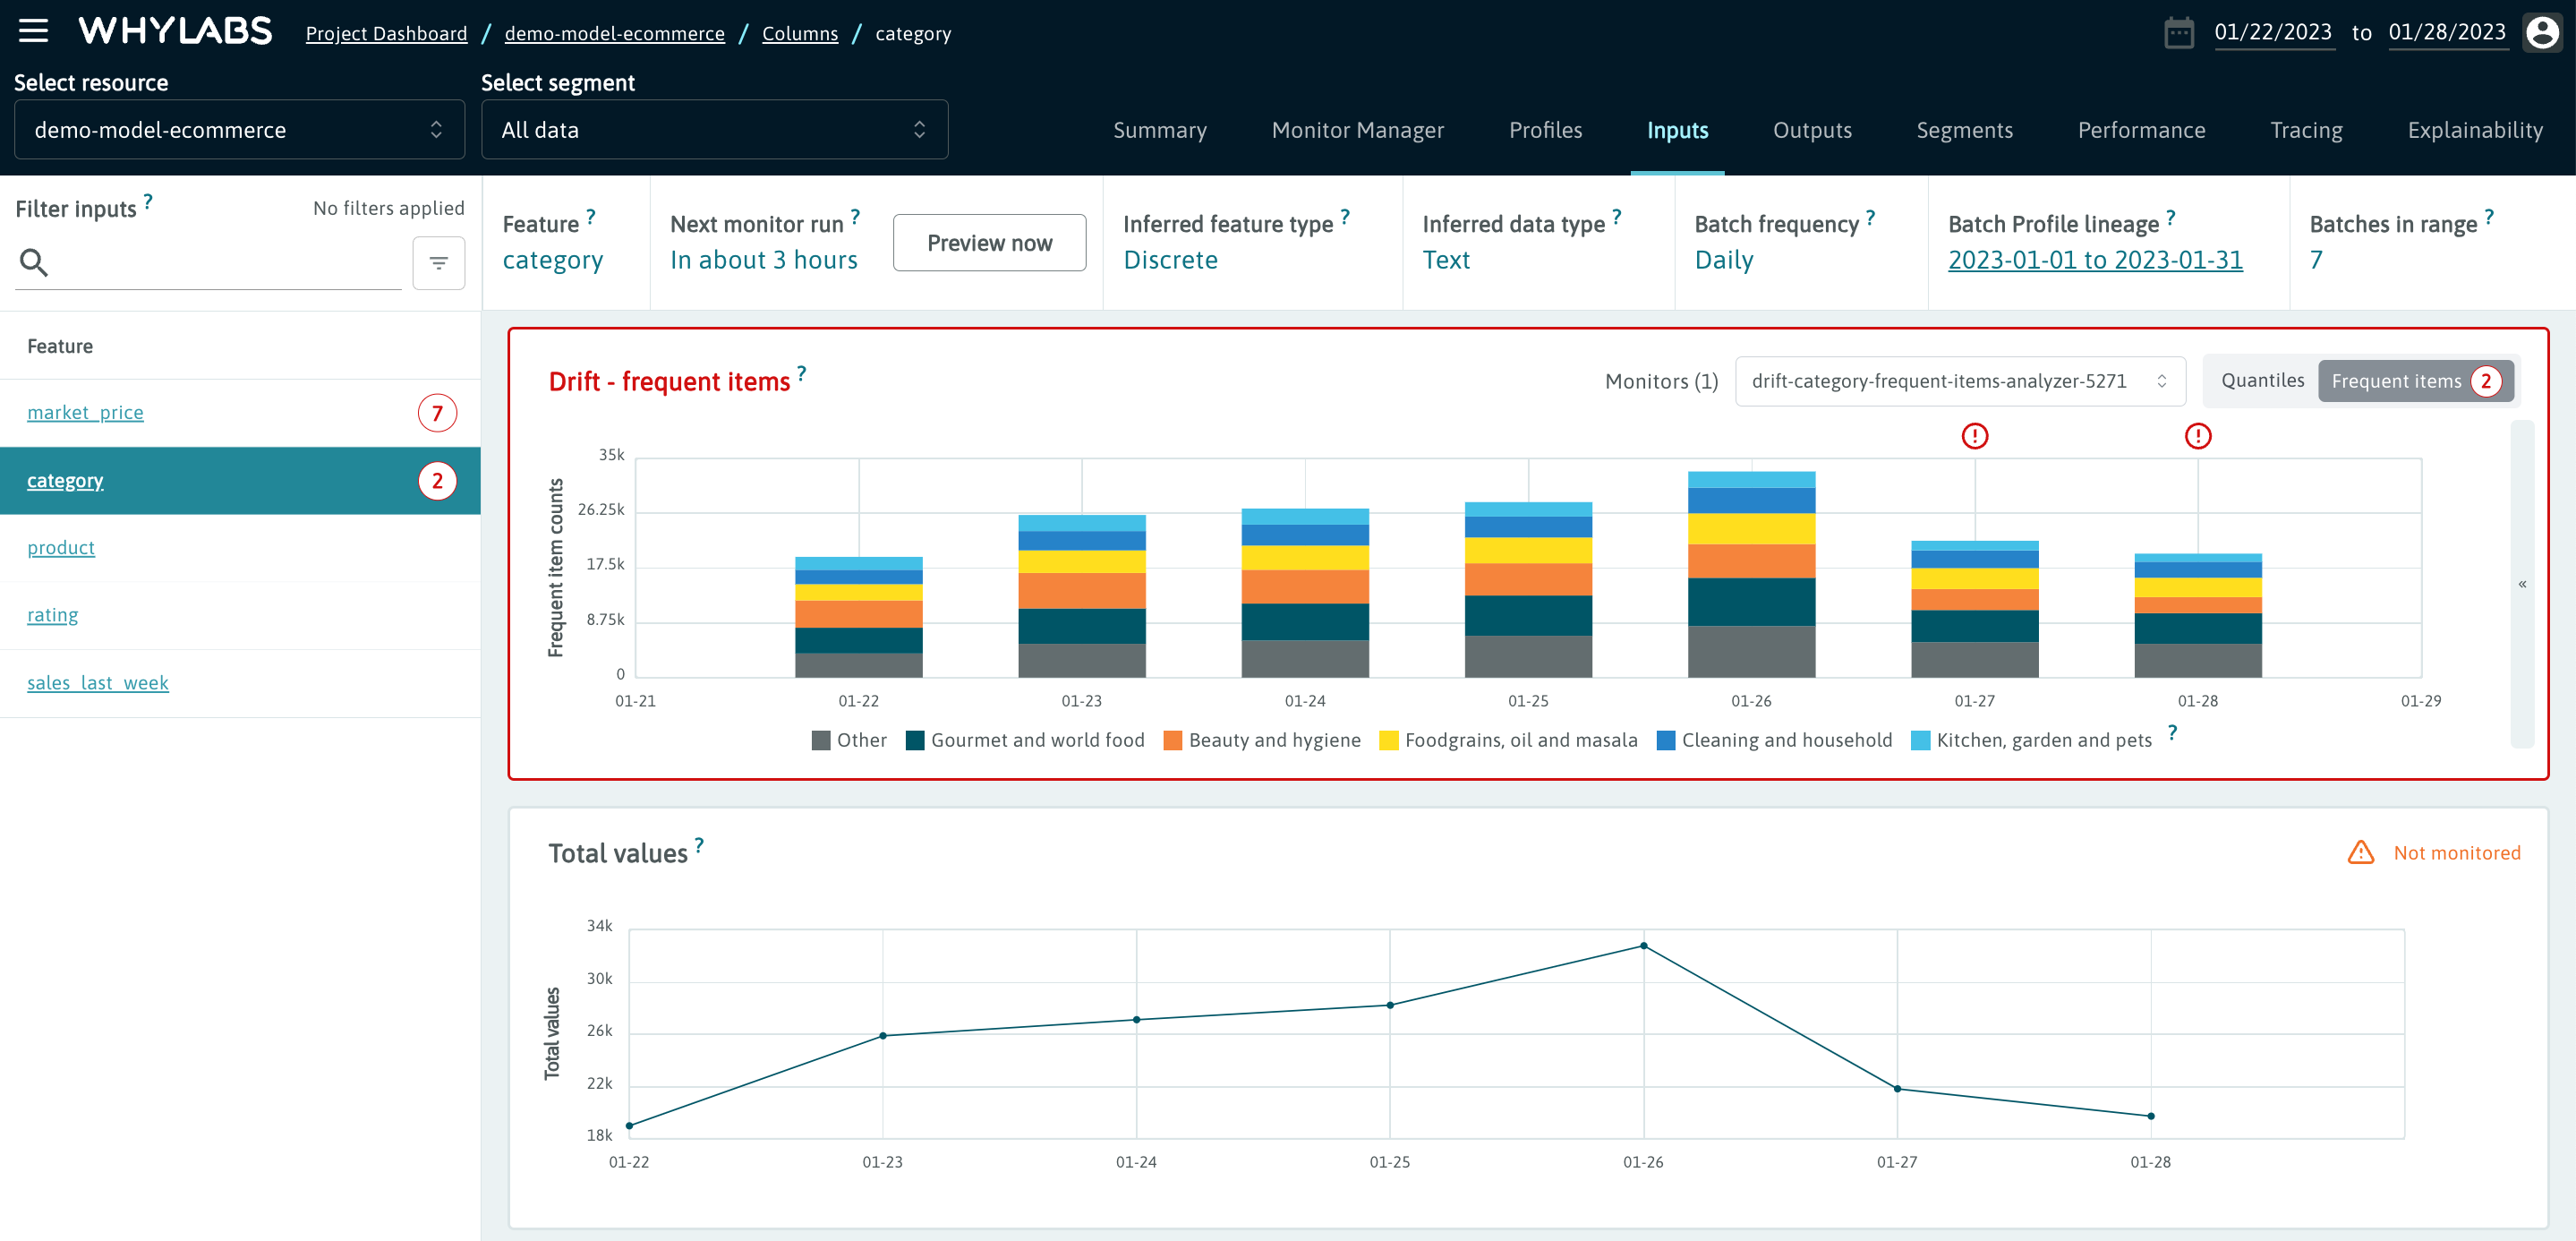
From this view, users can click on an individual feature or column for a fine grained view of monitored metrics for that feature. From here, users can view:
- Drift distance (if the feature is monitored for drift)
- Distribution showing estimated quantiles for non-discrete features
- Distribution of most frequent values for discrete features
- Individual statistics for continuous features (mean, median, min, max)
- Missing value count and ratio
- Estimated unique values count and ratio
- Inferred data type
The "Inputs" and "Outputs" tabs are displayed for all models. Inputs represent the data provided to the model or other columns useful in profiling (e.g., sensitive attributes for monitoring fairness, derived statistics about the input data such as toxicity or sentiment in large language models). Outputs represent inferences or other columns generated by the model, as well as statistics derived from the outputs.
Outputs are initially set to be any column with 'output' in the column name - this can be changed using the WhyLabs entity schema API.
A single "Columns" tab is displayed for datasets other than data transforms. "Inputs" and "Outputs" tabs are shown for data transforms, with inputs representing the data to be transformed and outputs representing the transformed data.
Drift Comparison
Drift is an important early indicator of possible model performance problems. On the "Inputs" tab, users can visualize the drift of the model inputs and compare it with the specific baseline or baselines against which it is being monitored.
Segments
What is a segment?
A segment is a subgroup of your data or a prediction slice. You can segment your data based on any categorical column or feature in that data (be it for an ML model, data pipeline, data stream, or dataset). For example, you can choose to segment your data by geographies such as “zip code” or “country”, or human attributes like “gender” or “age range”.
Segments are powerful because they allow you to monitor changes in specific categories, classes, or other subsets of your data. They can detect bias or changes that may not be visible when only monitoring the dataset as a whole.
When uploading profiles with whylogs, users can define segments they wish to slice their data on. This is reflected in the segments section.
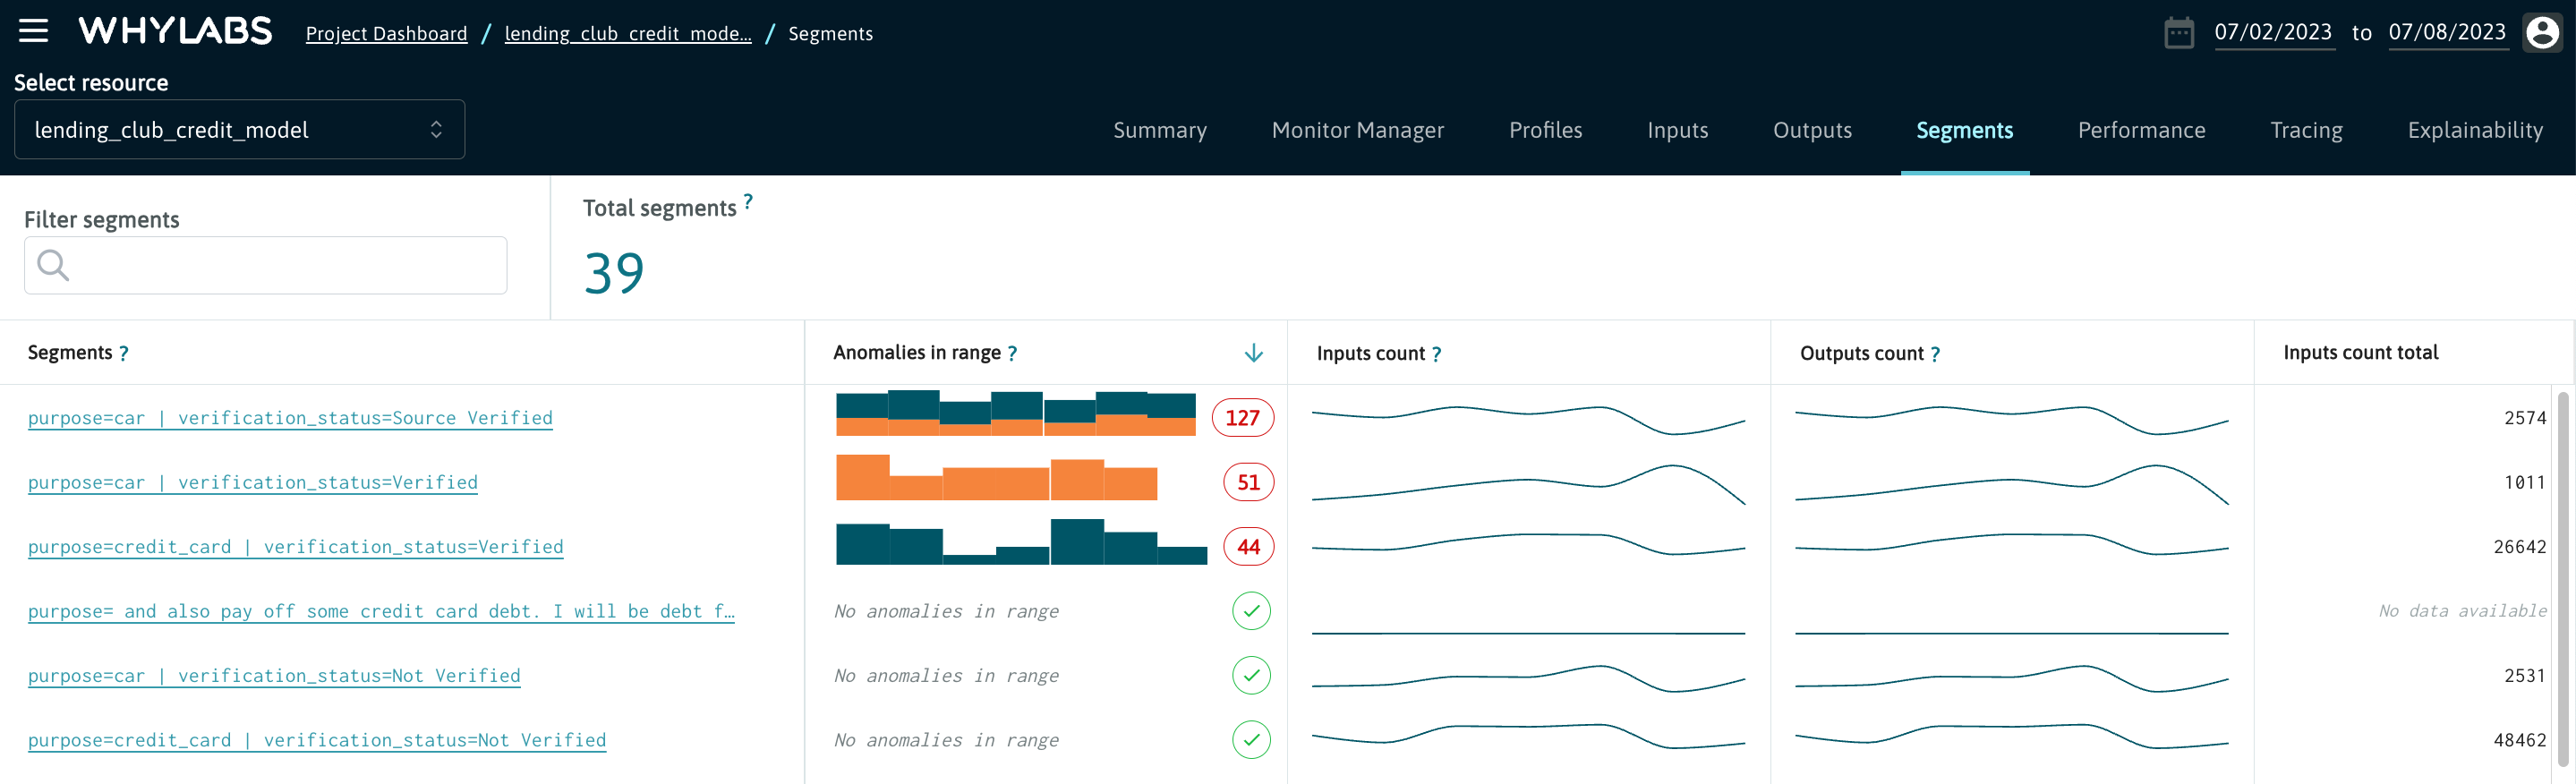
The "Segments" tab contains all of the individual segments defined by users when uploading profiles.
Users can click on one of these segments to view the details tabs (e.g. "Inputs", "Performance") filtered to data within the segment.
See Segmenting Data for more details about segments.
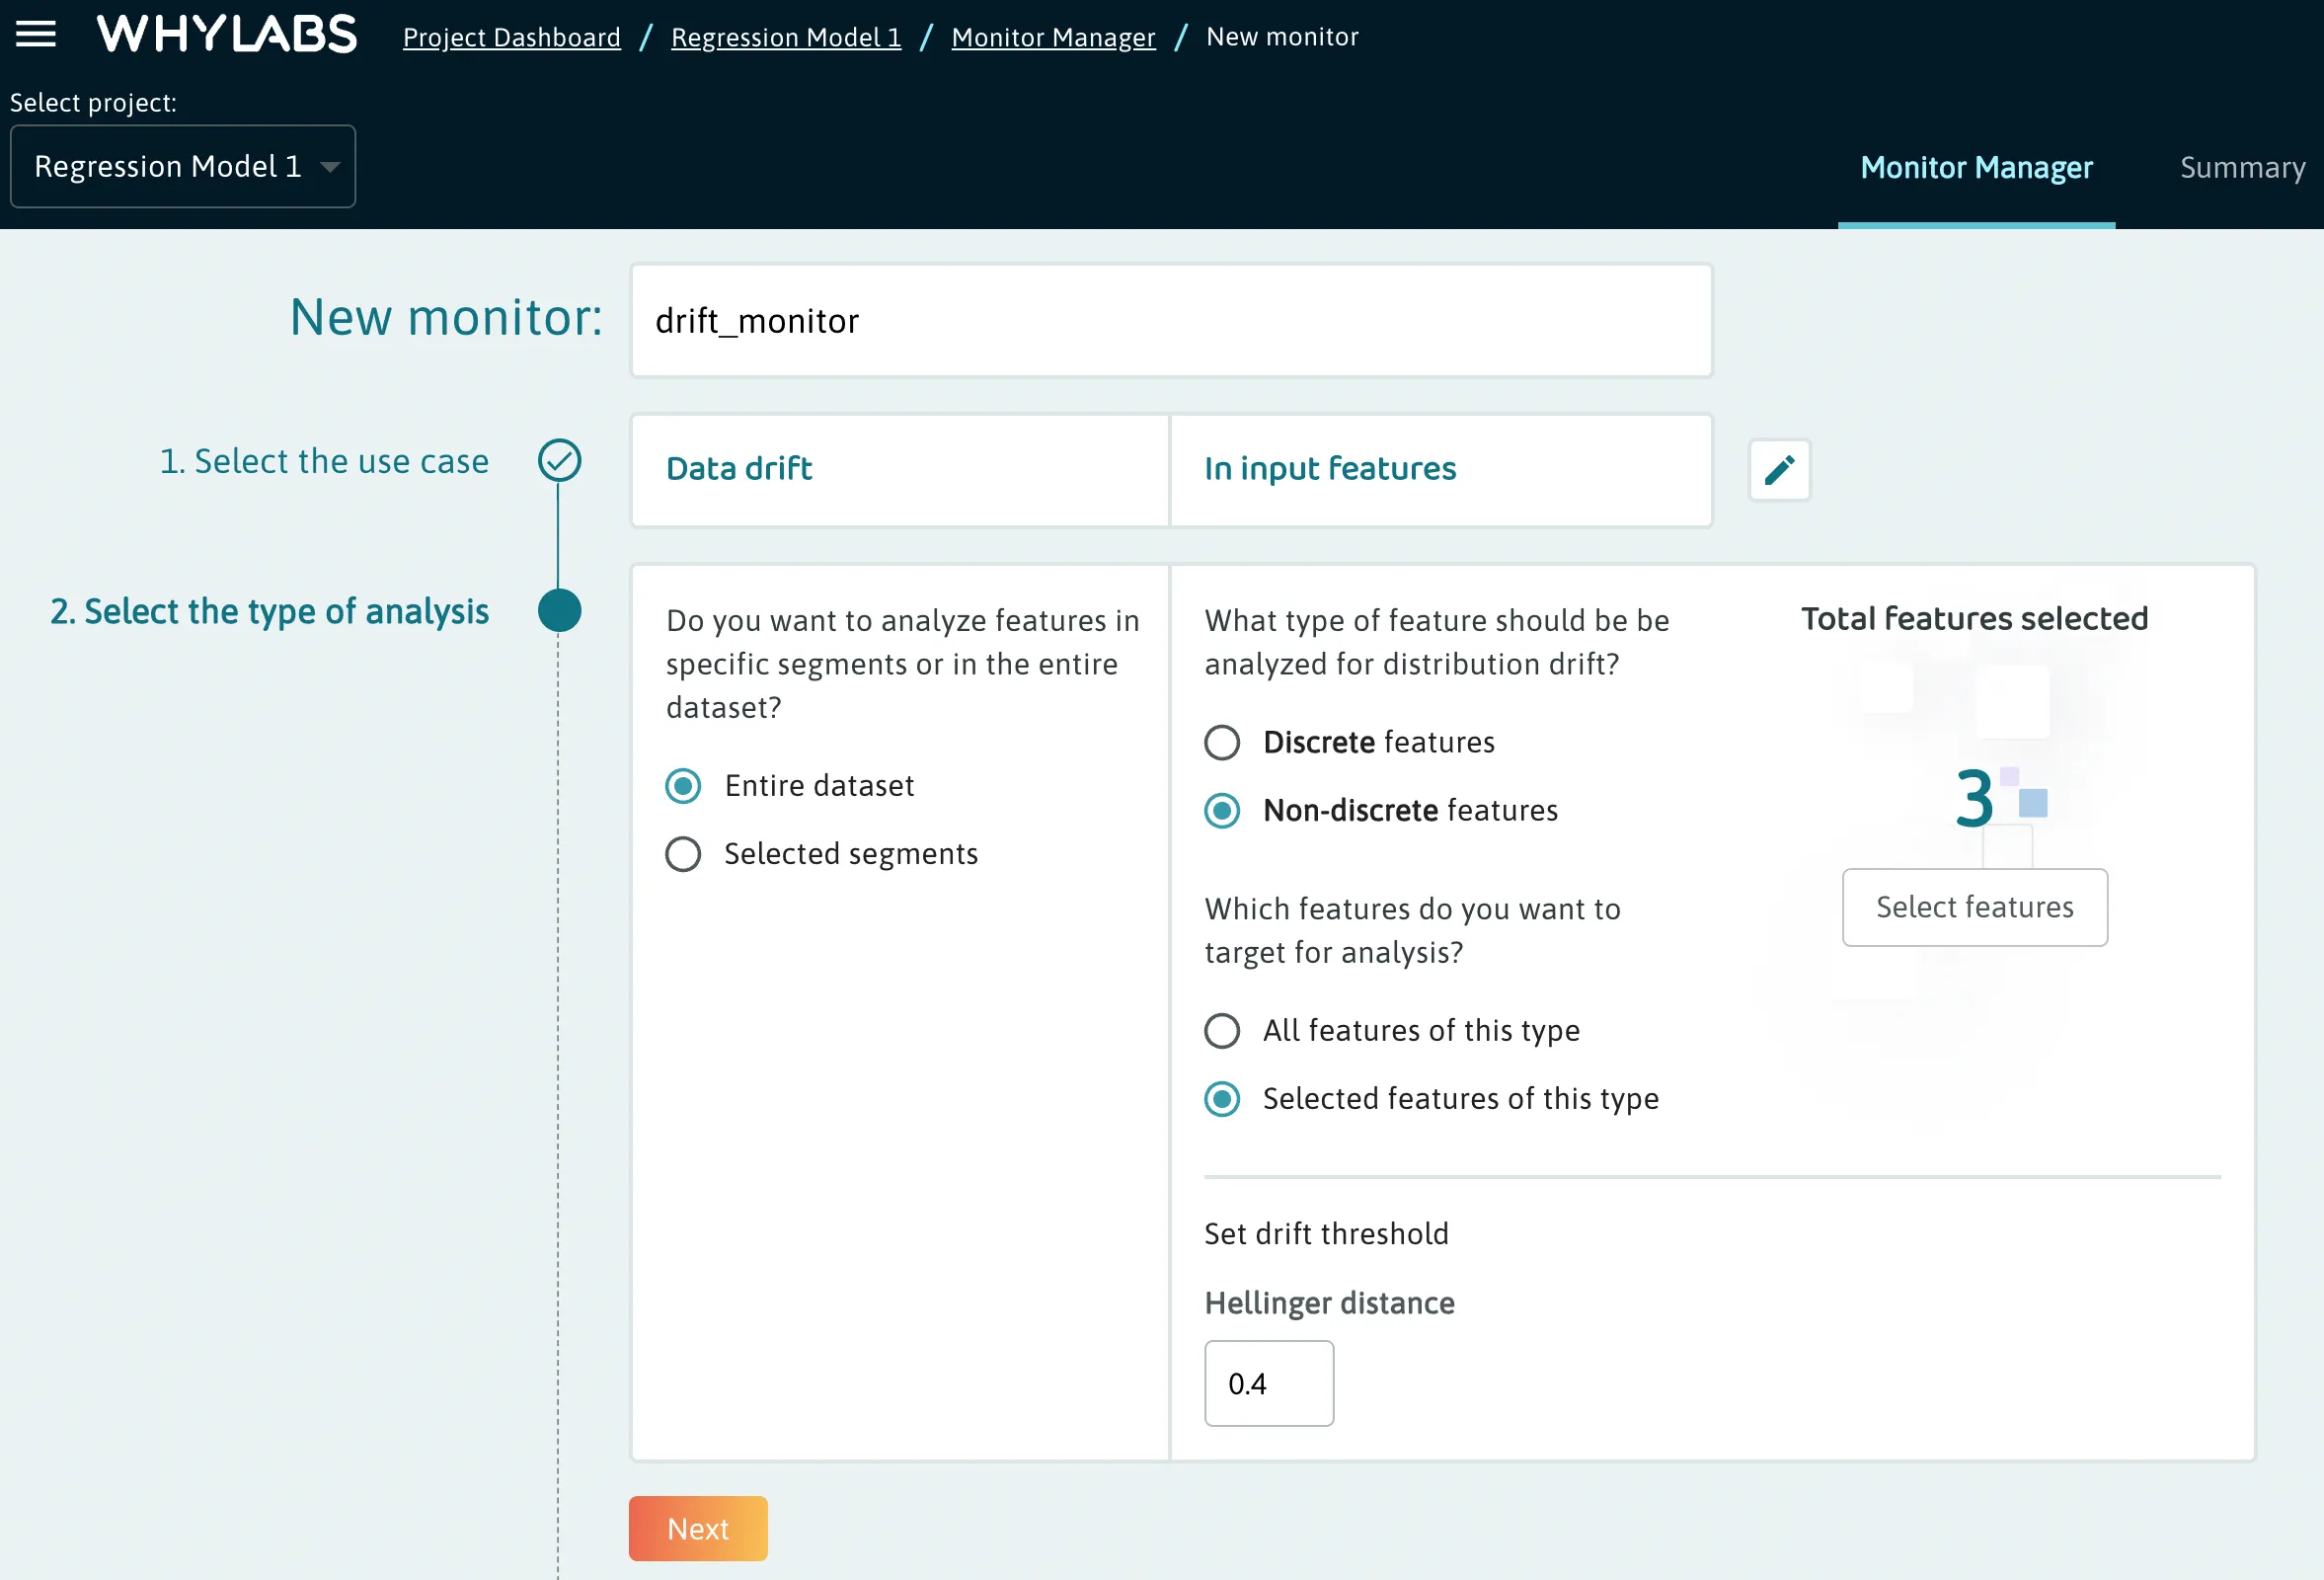
Monitor Manager
The Monitor Manager tab allows users to customize their monitors for a particular resource. This includes:
- Choosing a monitor type
- Targeting specific features/segments
- Setting analysis type & thresholds
- Setting a baseline
- Configuring actions
Users can also choose a monitor from a variety of presets.
See the Monitor Manager Overview for more details.
Performance
The "Performance" tab contains a summary of performance metrics. The performance metrics that are available for the current model are automatically rendered in the dashboard. Different metrics will be displayed depending on the model type (classification, regression, ranking, etc. ).
Note that this view is only available for model resources. To visualize the performance data, users must select the appropriate model subtype from the model settings page, and upload performance metrics via whylogs.
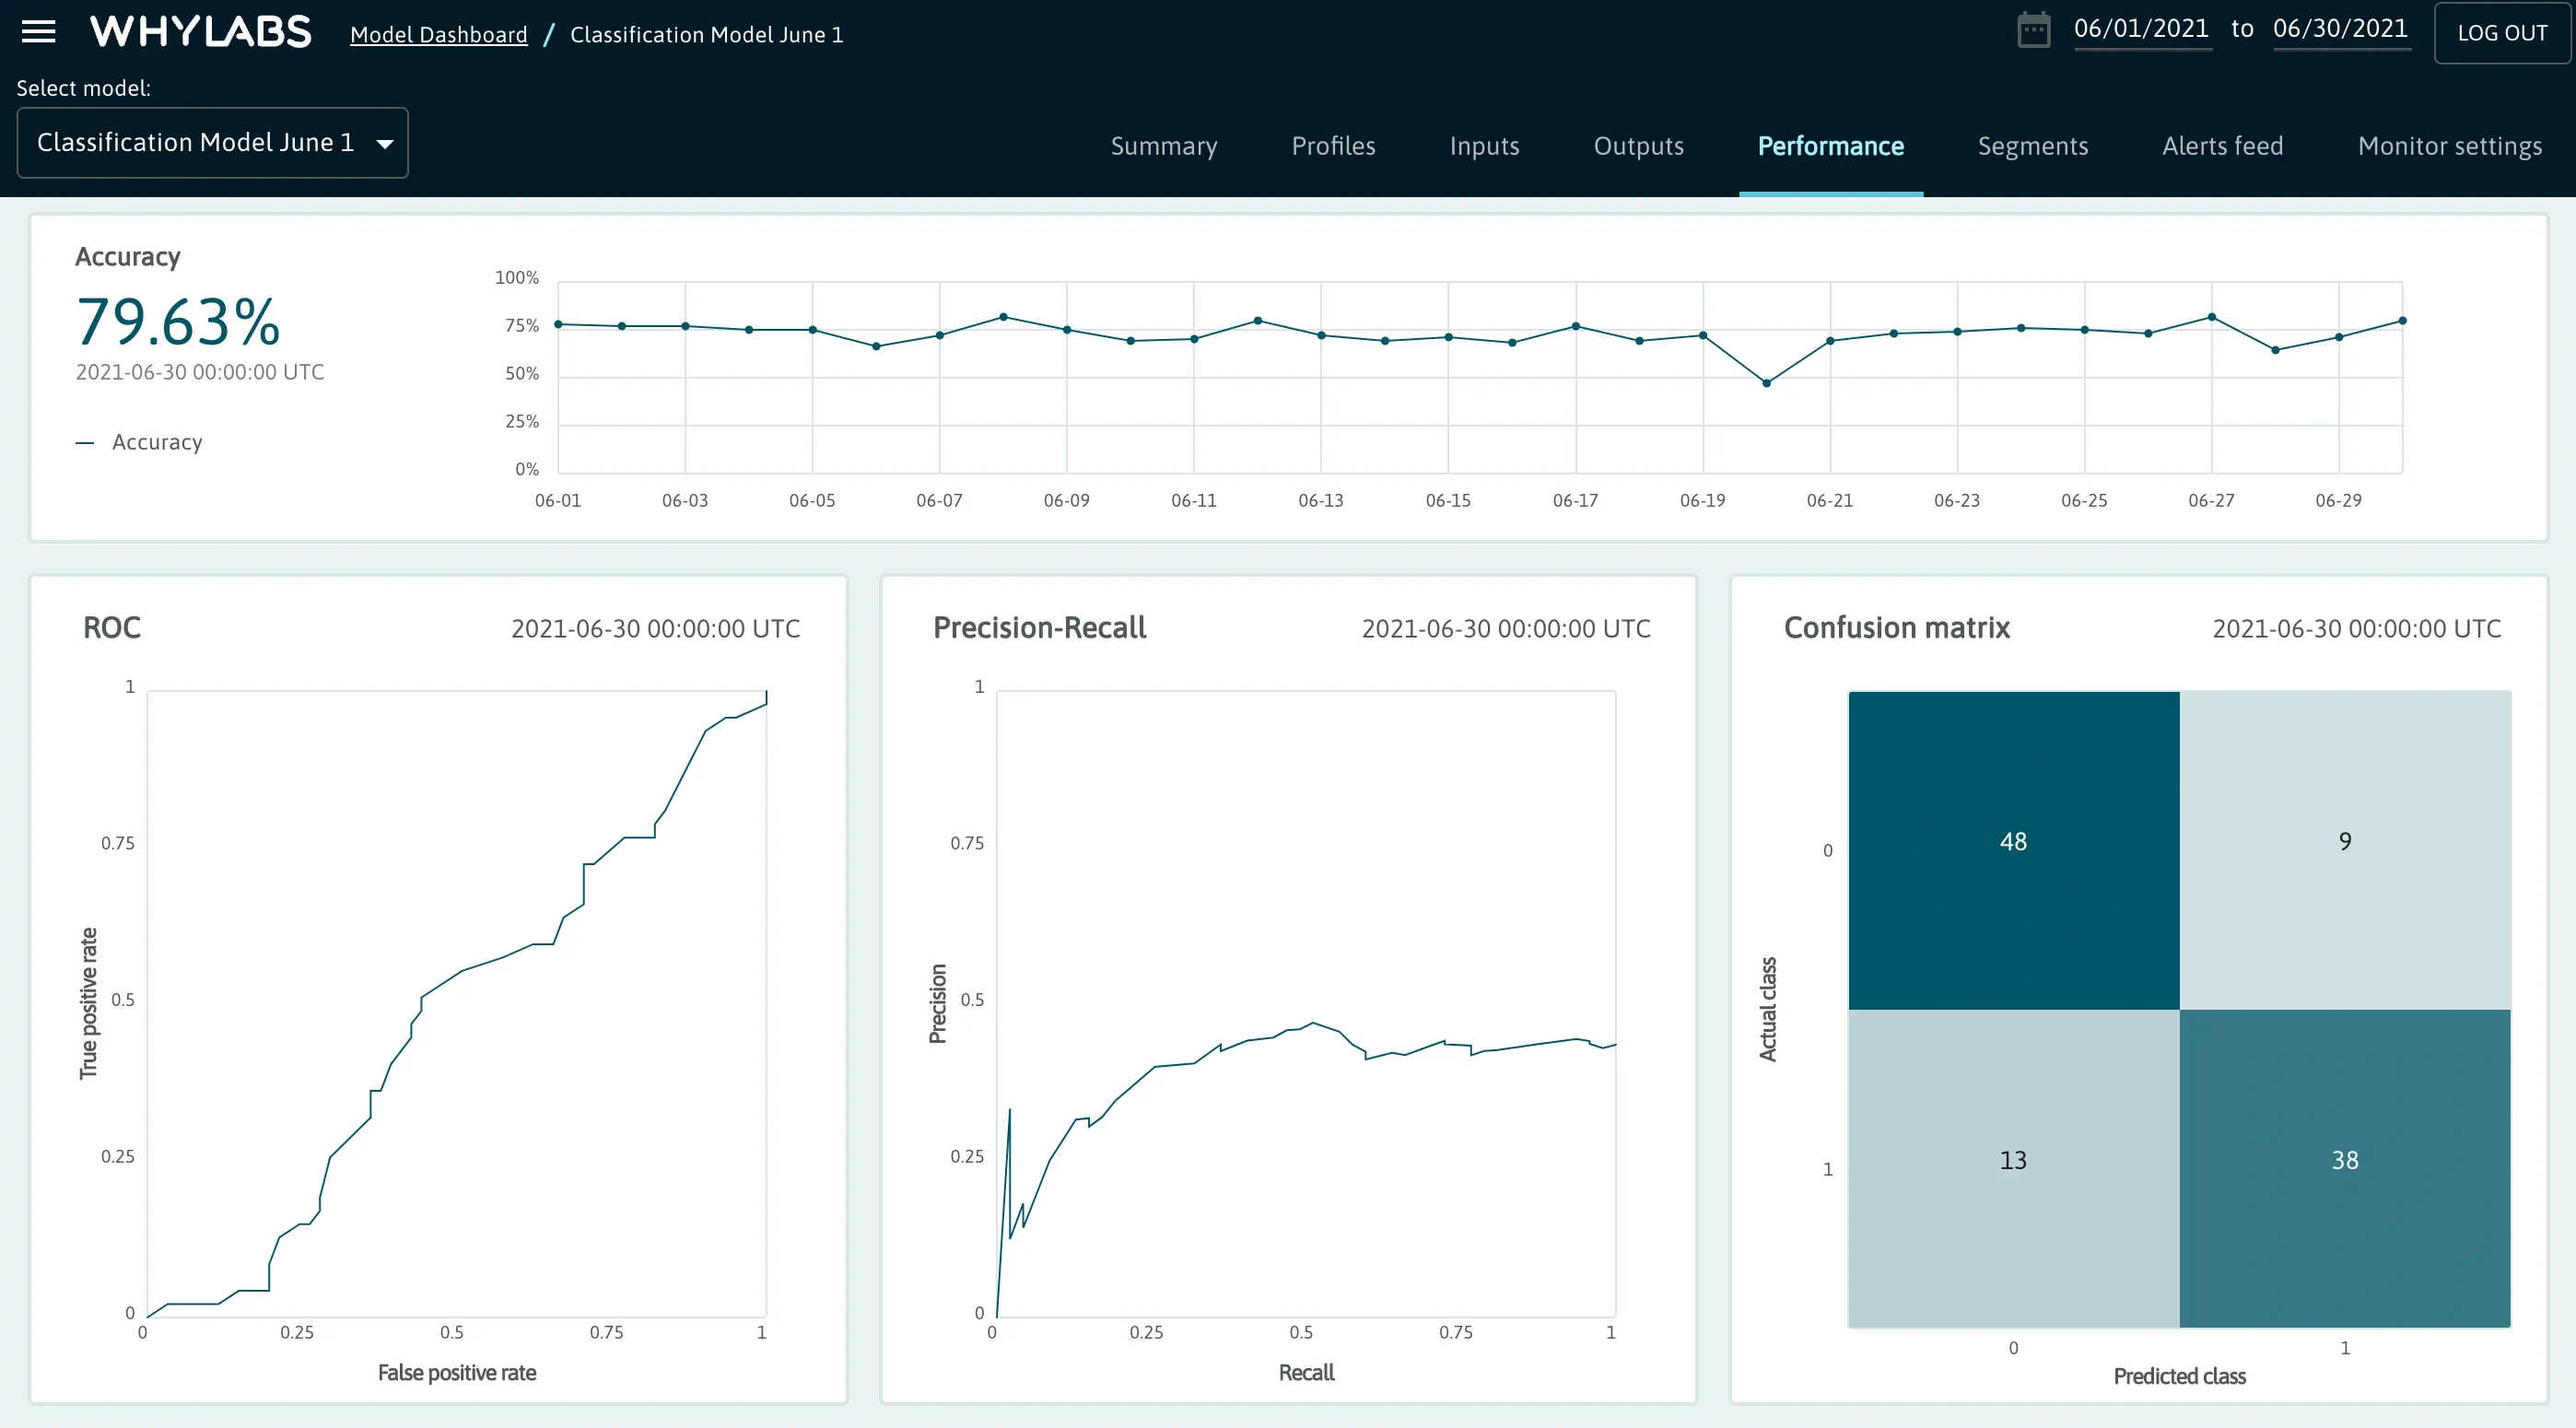
Classification
- Total output and input count
- Accuracy
- ROC
- Precision-Recall chart
- Confusion Matrix
- Recall
- FPR (false positive rate)
- Precision
- F1
Regression
- Total output and input count
- Mean Squared Error
- Mean Absolute Error
- Root Mean Squared Error
Ranking
- Average Precision @ K
- Reciprocal Rank
- NDCG @ K
- Precision @ K
- Recall @ K
- Top rank
- Gain sum @ K
See the Performance section for more information about working with performance metrics.
Segment Analysis
The "Segment Analysis" tab is enabled for resources with segmented data, and lets users analyze a wide list of column and dataset metrics across segments. The dashboard supports various debugging and root-cause workflows including:
- Discovering which segments within the data contribute negatively or positively towards model performance,
- Investigating if there's bias in either the dataset or a specific segment,
- Identifying potential data quality problems in segments
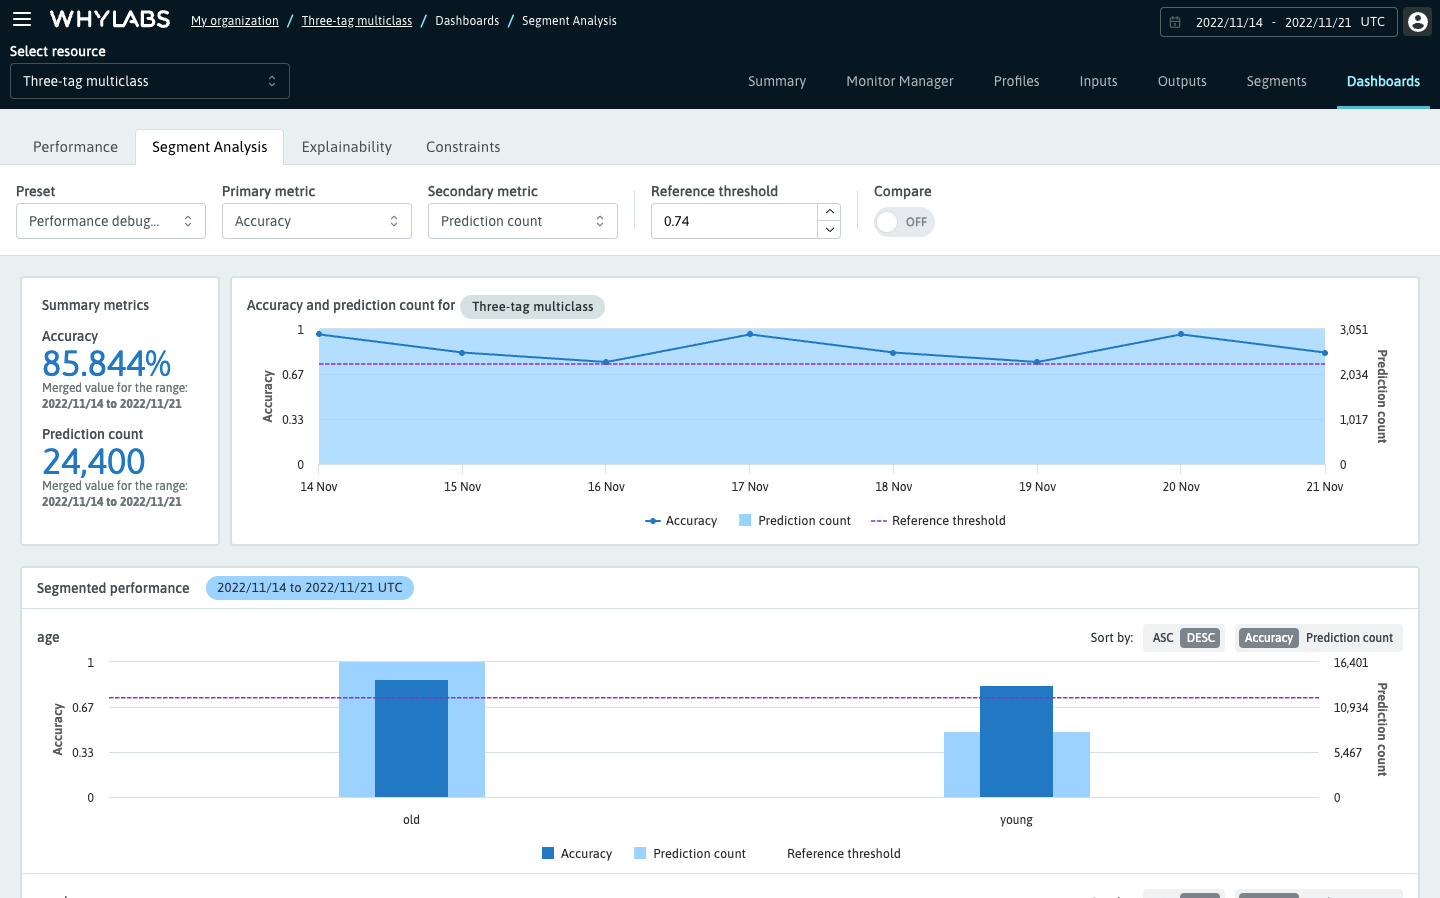
See the Segment Analysis section for more details.
Explainability
The "Explainability" tab is available for Model resources. It lets users view feature importance for a model's inputs, and compare them with other models.
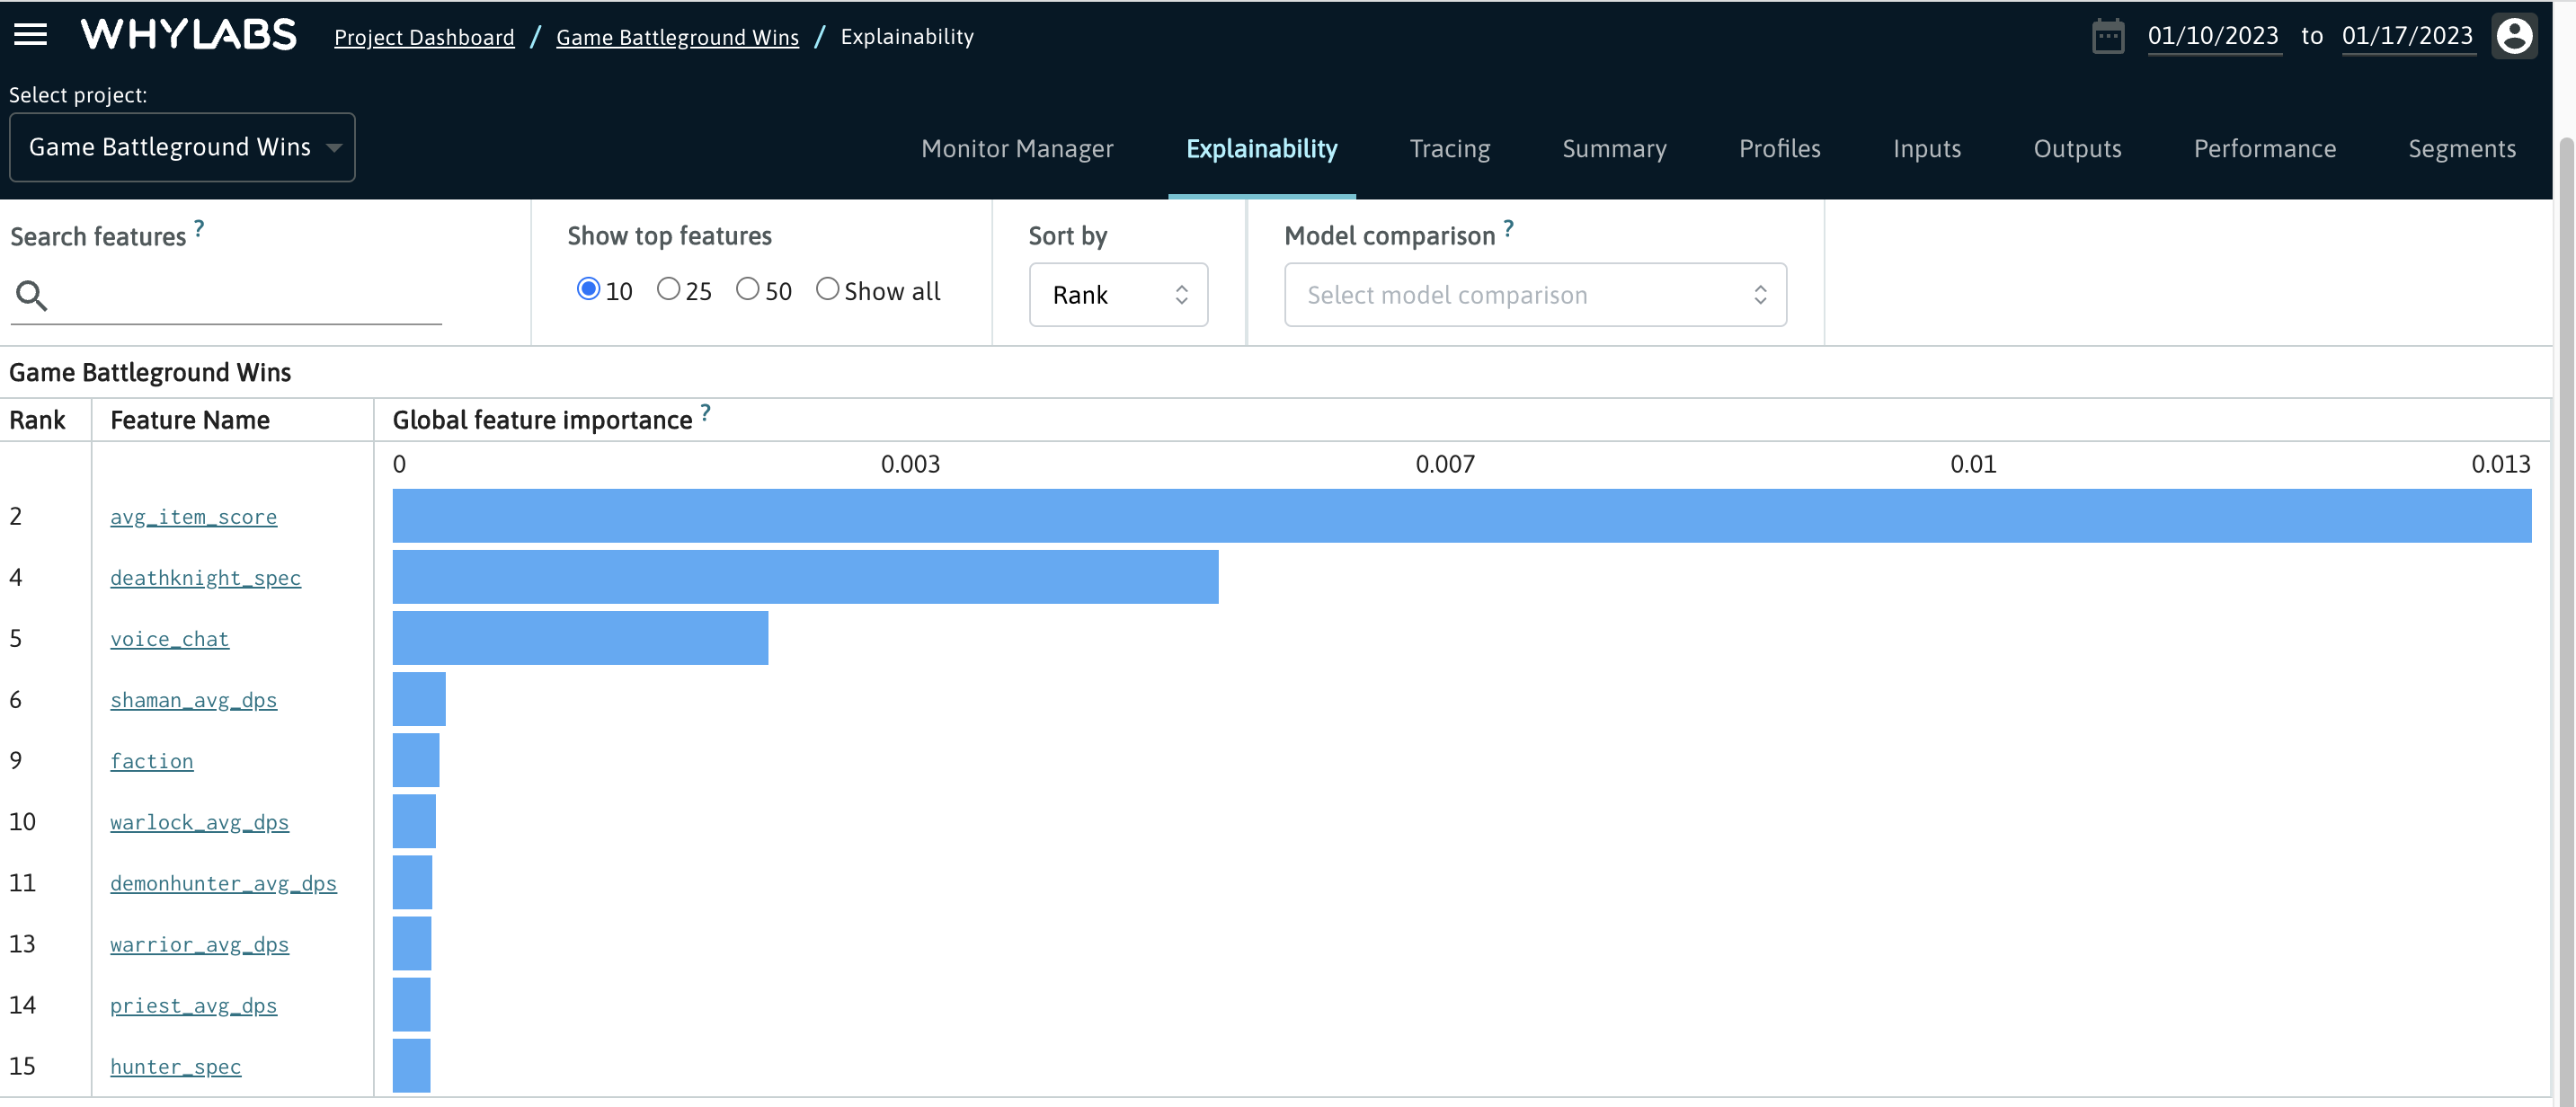
See Explainability section for more details.
Explainability data can be uploaded using the Feature Weights API.
Anomalies Feed
The Anomalies Feed allows users to see a centralized feed of all anomalies for a given resource. It is located on the Monitor Manager tab. This view includes the anomaly timestamp, anomaly type, column, and anomaly description.
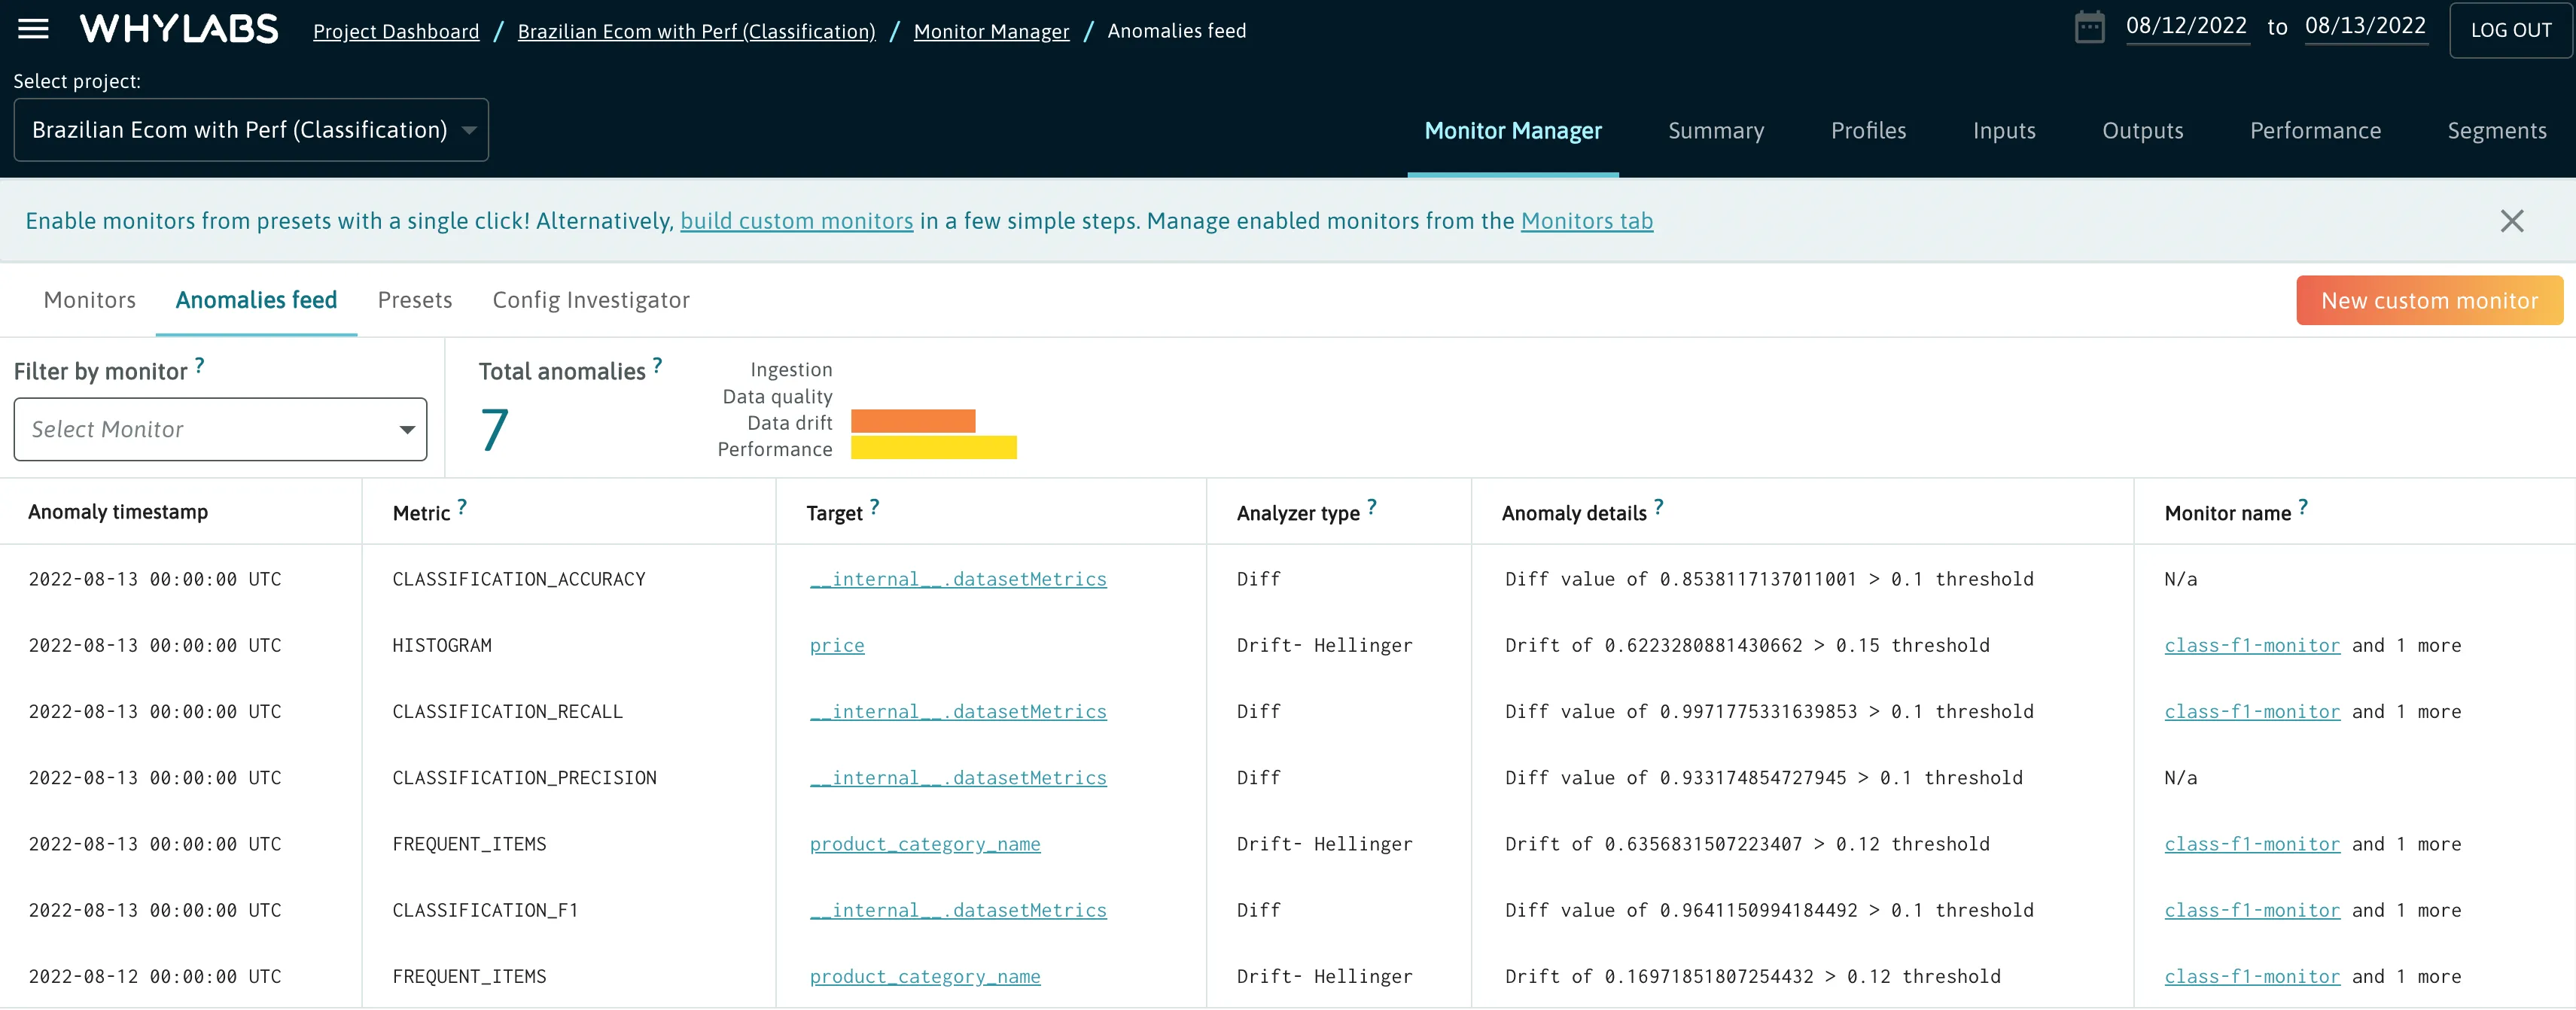
For more details, see the Anomalies section.
Organizations
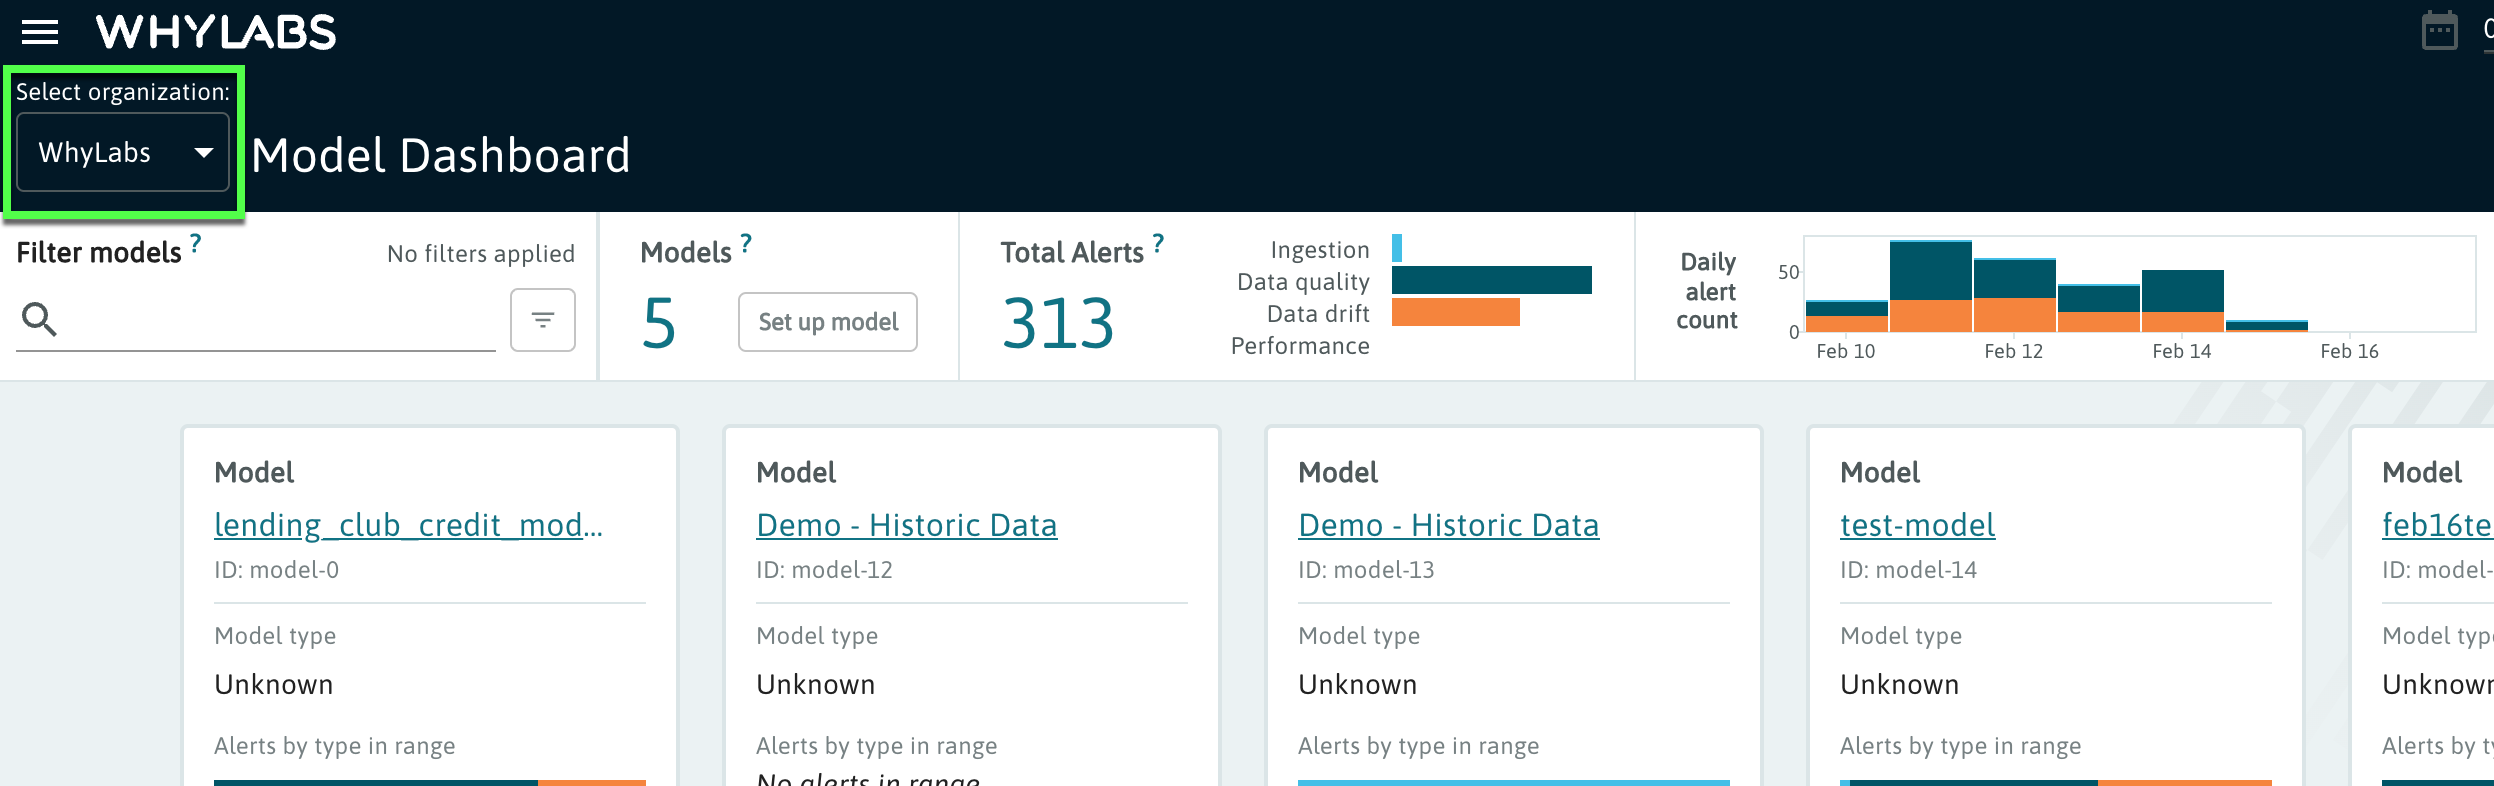
An Organization is the highest level entity within the WhyLabs platform. An organization houses any number of WhyLogs models and contains any number of users. A model can only belong to one organization, but users can potentially be added to multiple organizations.
Upon creating a free account in WhyLabs, an organization will be created and your user will be added to that organization. Users belonging to multiple organizations can switch between organizations using the organization dropdown in the Model Dashboard
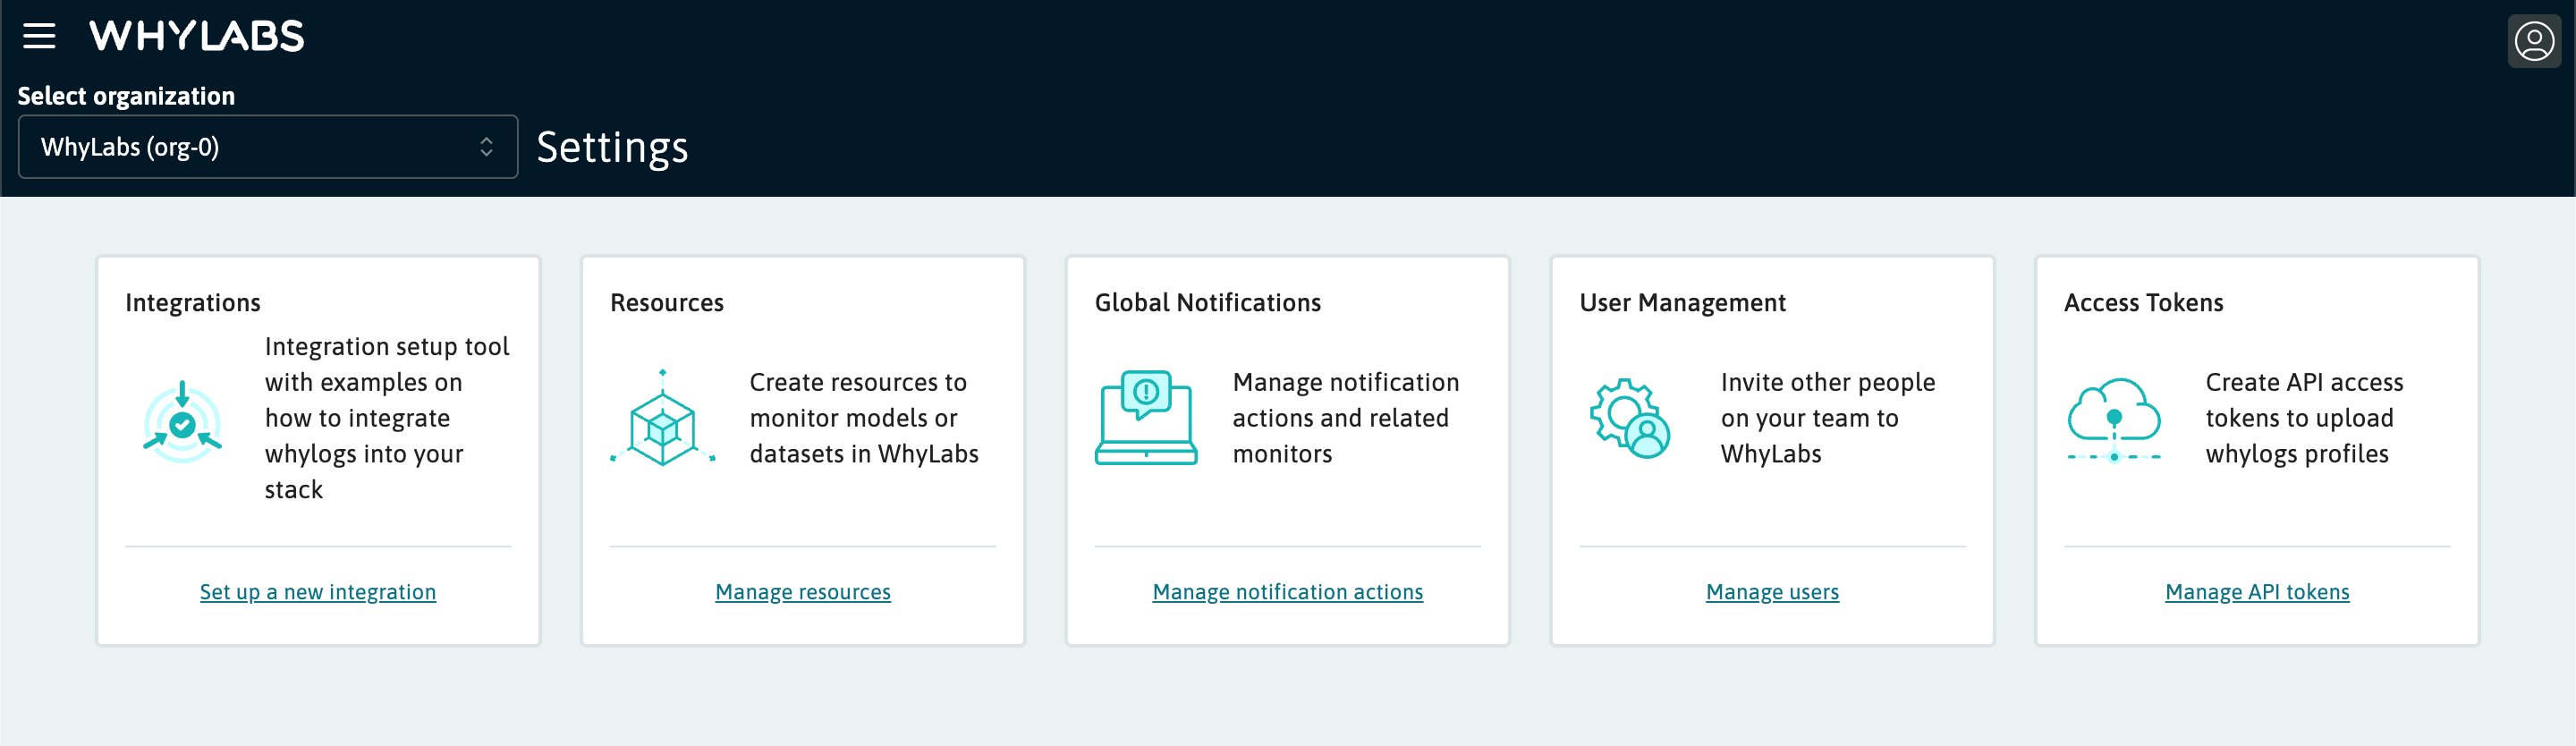
Settings
The settings section can be accessed from the hamburger button in the top left corner of the WhyLabs dark header. From here, you can access integration examples, manage resources (models and datasets), set-up notifications, manage users and permissions, and manage API keys.
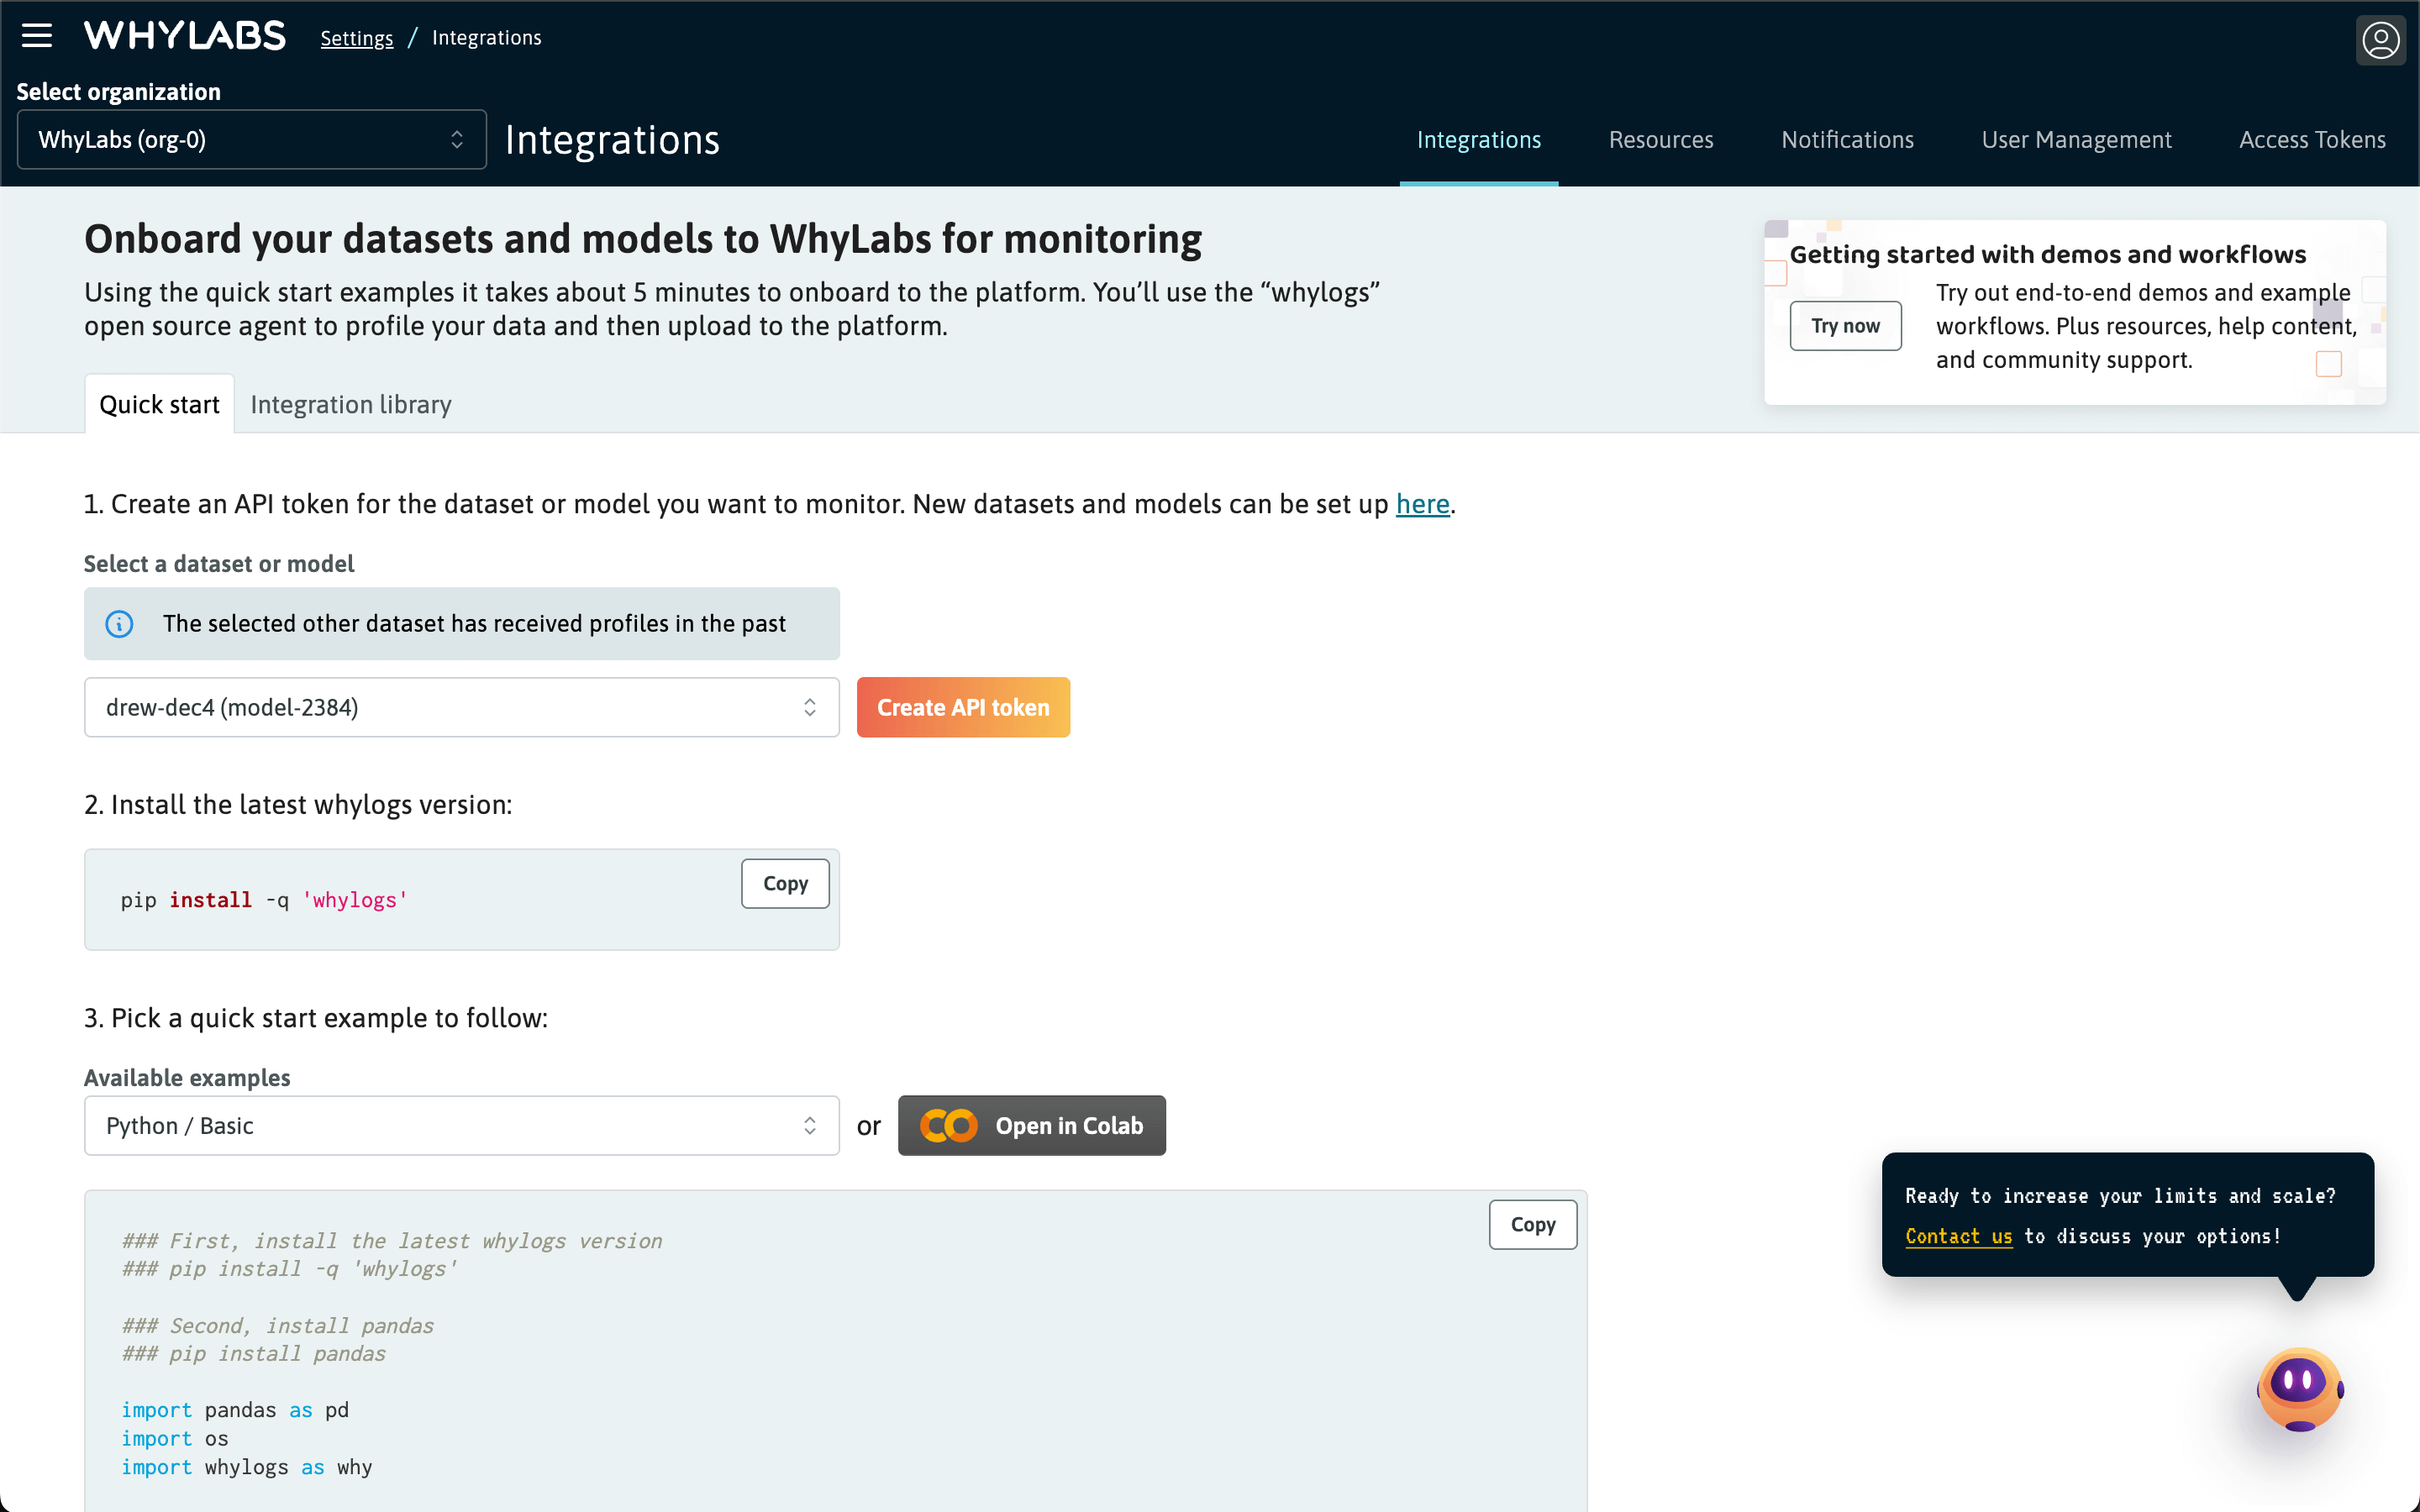
Integrations
From the Settings overview, it's possible to access the Integrations tab. From here, the Quick Start page contains tools to instantly generate code for several example integrations specific to models and datasets in your organization. The Integration Library contains a list of all available integrations, with links to relevant documentation and examples.
Resource Management
As noted earlier in the feature walkthrough, all models and datasets in WhyLabs are referred to as "Resources". From the Resource Management page, it's easy to onboard new models and datasets to enable observability, monitoring, and LLM secure related capabilities. In addition, users can manage tags for resources and edit their settings.
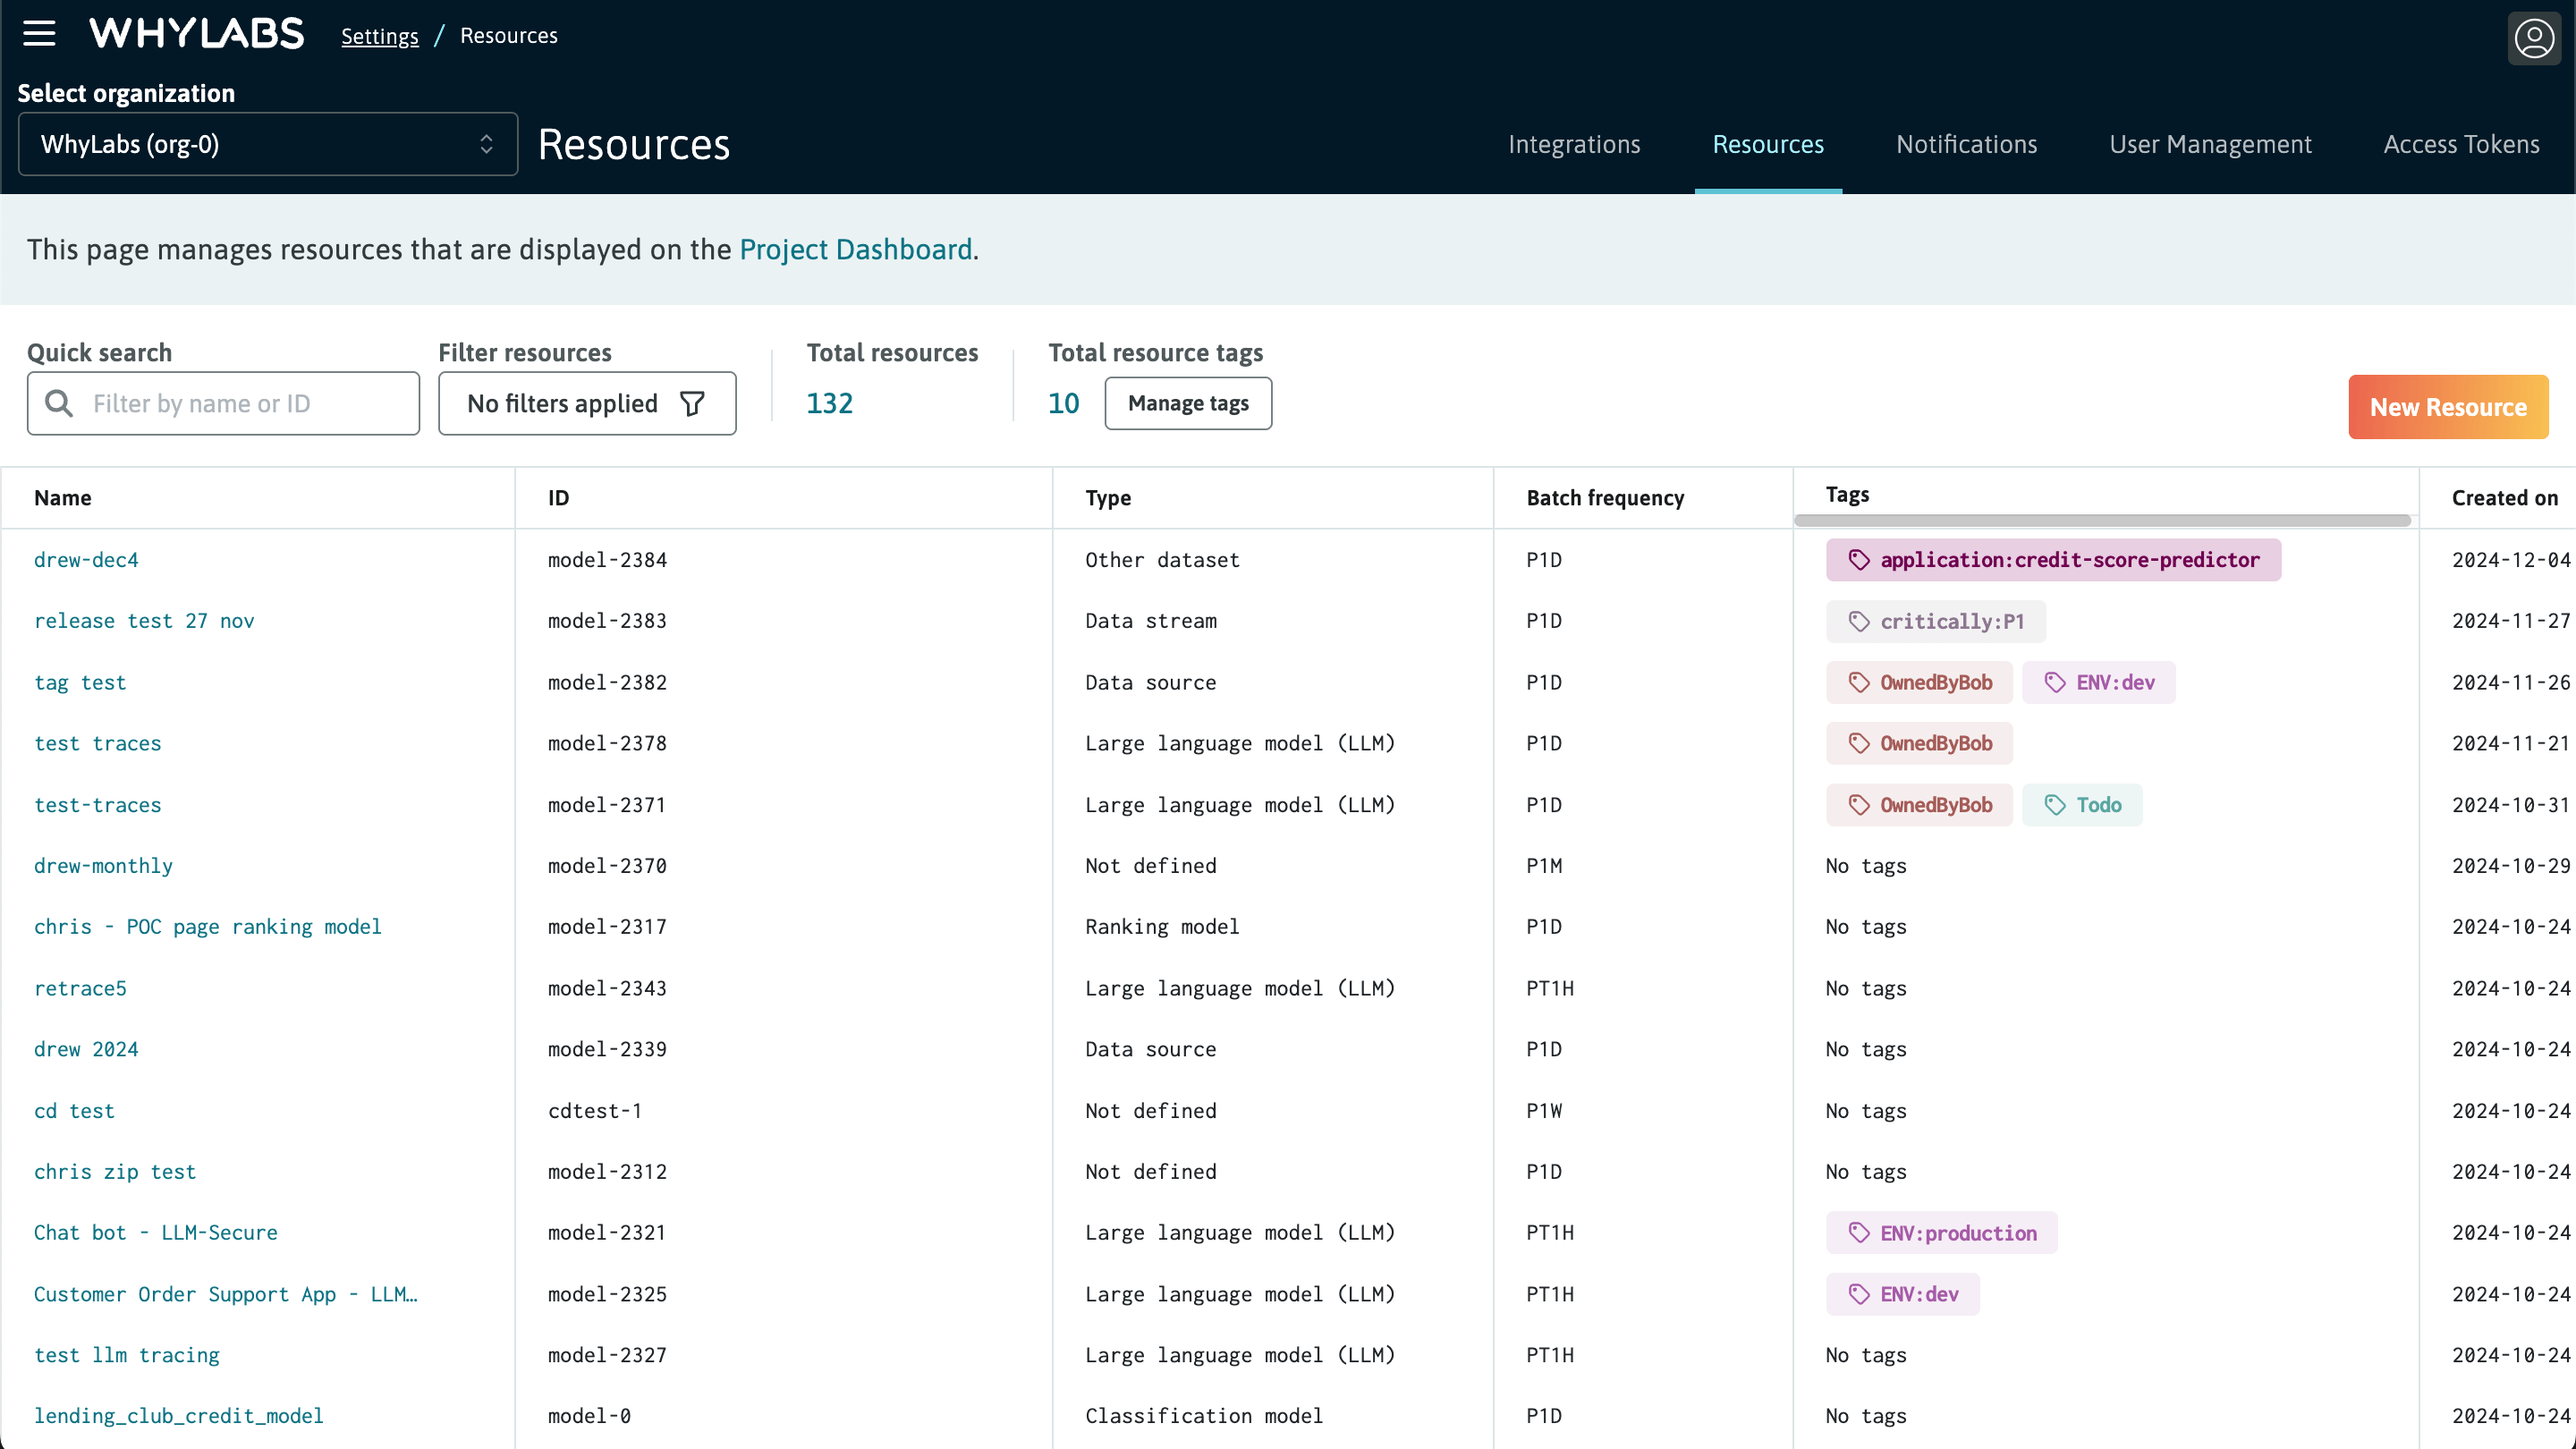 Resource management page for creating and managing models, datasets, and their tags
The resource management page has the following information and controls at the top of the page:
- Quick search: use this to search by text substring for a resource name or ID
- Filter: use this to filter resources on different attributes like model type, dataset type, or tags
- Total resources count: a quick view of the number of resources in the currently filtered group
- Total resource tags: a quick view of the number of resource tags present in the organization
- Manage tags control: administrators can click this button to edit the organization's resource tag schema
- New resource button: use this to create a new model or dataset
Onboarding new resources is as simple as clicking the "New Resource" button and filling out the form. Provide a name, description, and optionally add tags for the resource. Note: tags cannot be created during this step, only applied. Details on creating and managing tags can be found in the Resource Tags section.
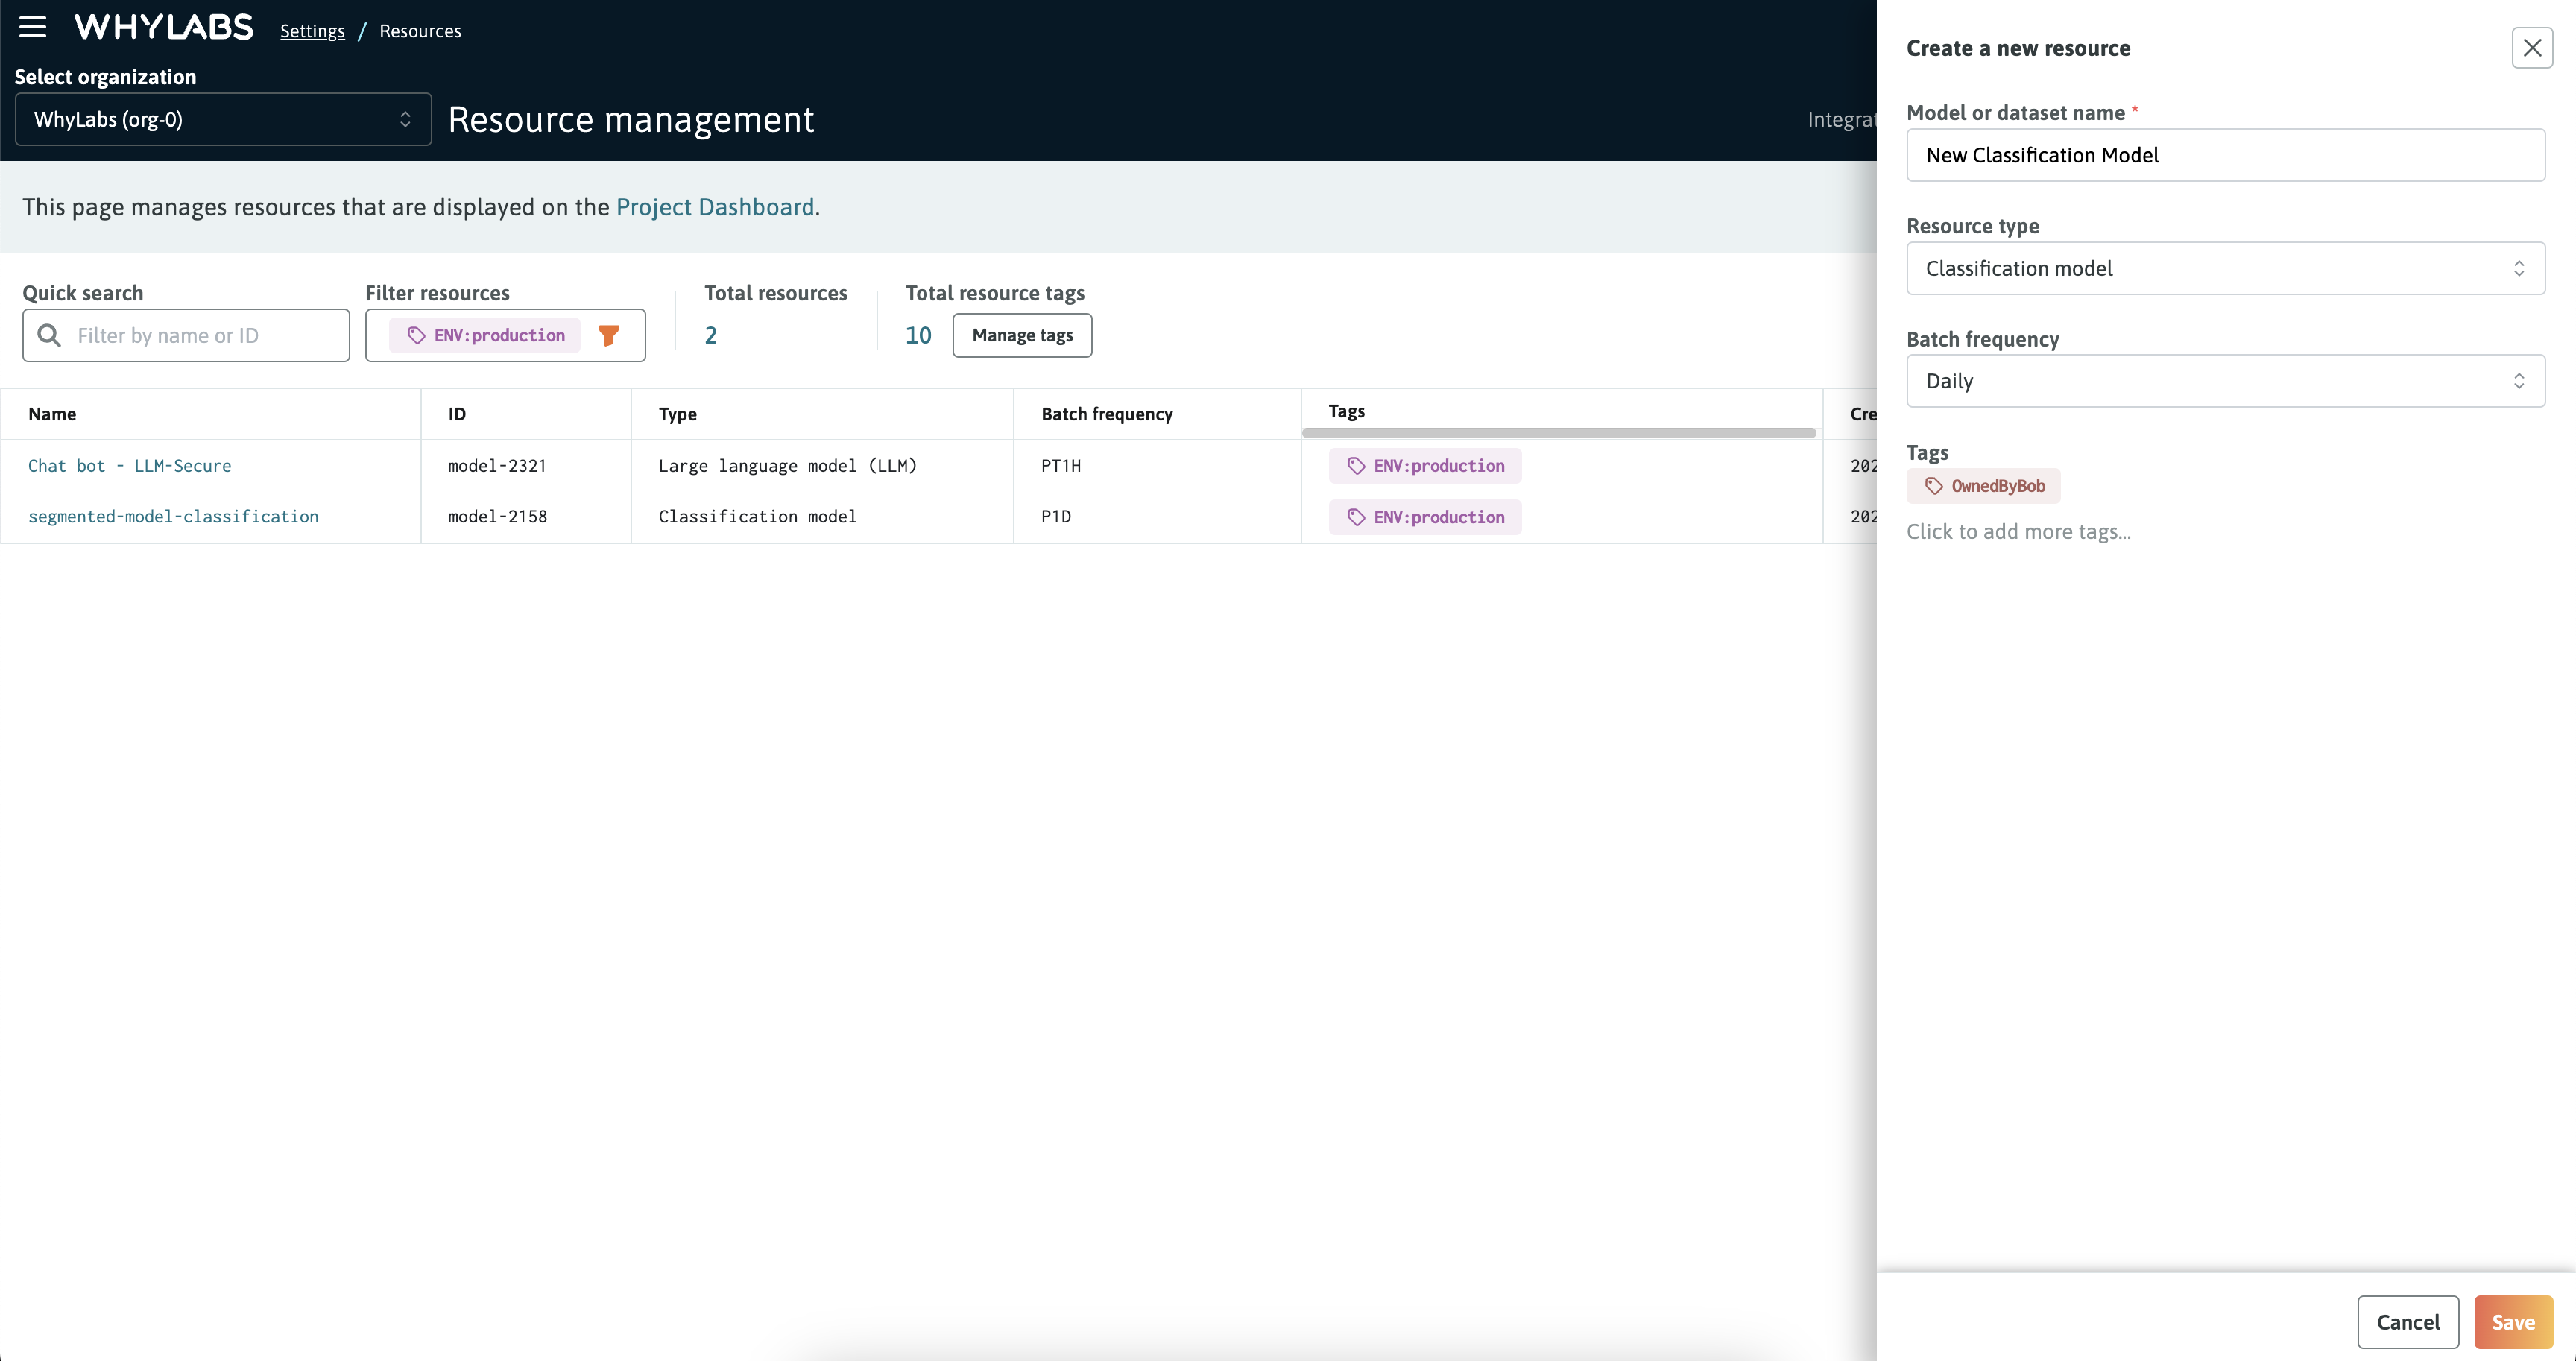 New resource form for creating a new model or dataset
It's possible the edit the metadata for resources directly from the table. Simply click on the edit icon for the field you wish to change, then update as needed from the form.
Resource Types
In WhyLabs, you can choose either a model or dataset resource type. There are a few primary differences between the two:
- models refer to profile columns as input or output features; datasets refer to them all as columns, there is no concept of input or output
- models include dashboards for performance metrics and explainability; datasets do not
- model monitoring includes presets for performance monitoring; datasets do not have these
Note: Large language models (LLMs) are a special type of model resource that can be selected from the model type dropdown. Only LLMs are compatible with the LLM Secure capabilities of the platform, so it's important to correctly set the resource type if you are planning to onboard the model to LLM Secure.
Resource Tags
WhyLabs provides an easy and intuitive way to tag models and datasets, which provides an additional way to organize and categorize them. As organizations can have many resources, tags make it possible to define a flexible schema that can be tailed to meet the needs of the organization. Tags can be either single string values, known as "labels," or key-value pairs known as "tags".
Users with the "Administrator" role can define and edit the available tag schema for an organization using a YAML format. Click the "Manage tags" button to view the YAML editor. The schema is comprised of two section: labels and tags. For additional flexibility it's possible to optionally set the background color and text color for any key. By default, keys are assigned default colors by WhyLabs, just like labels.
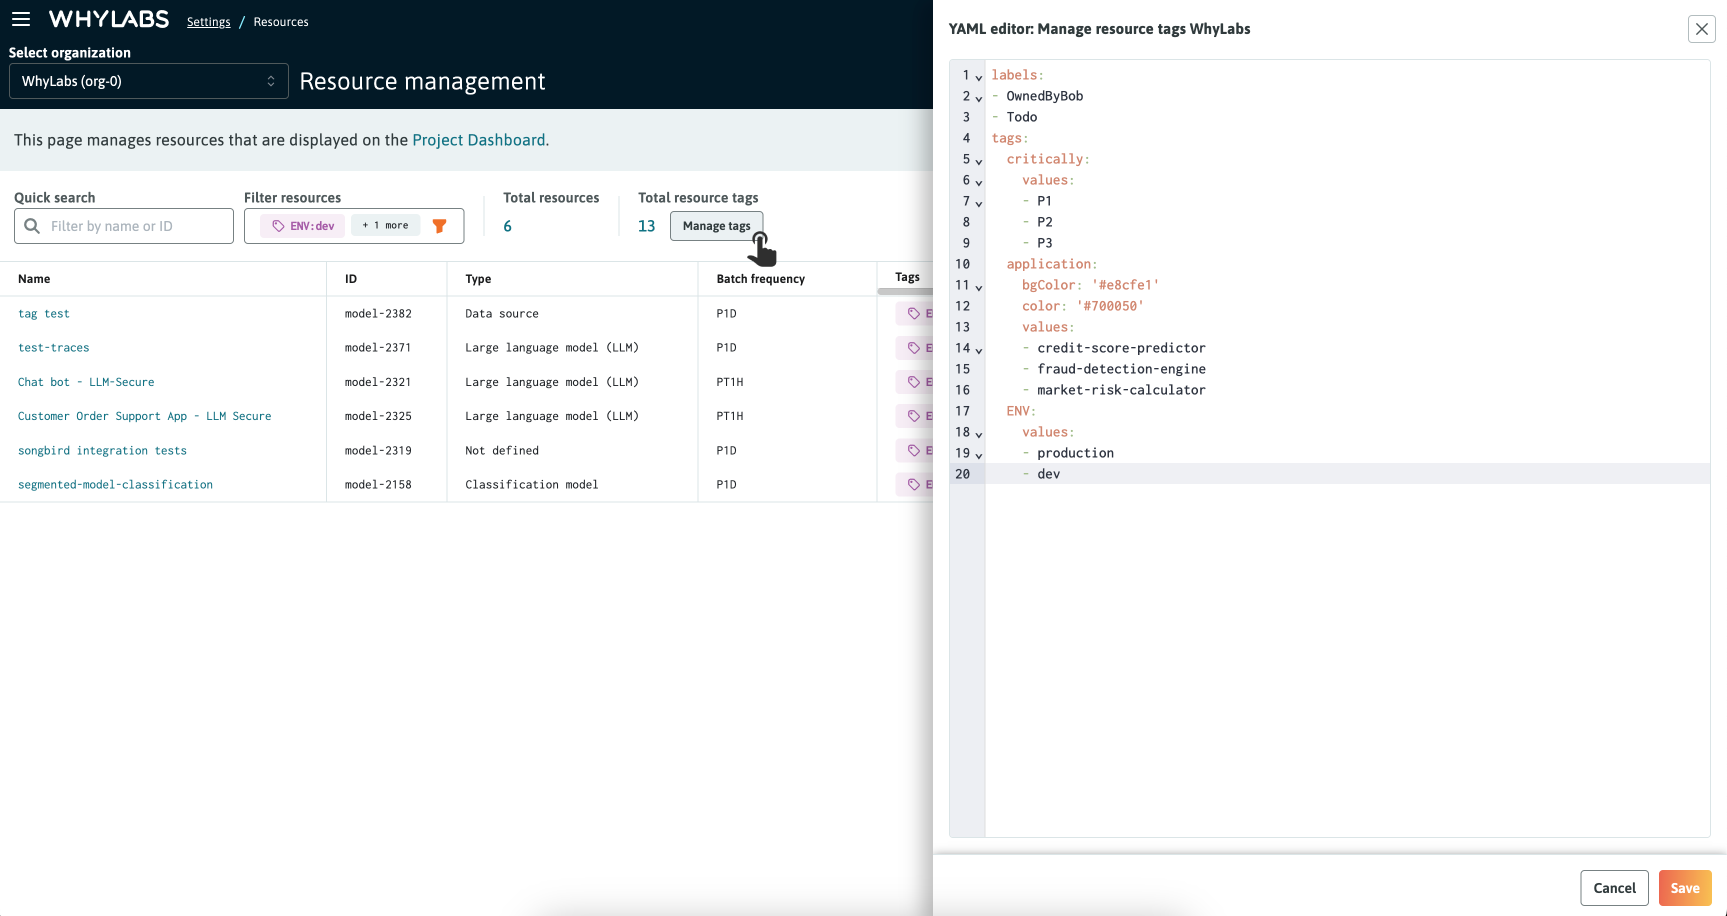
The YAML configuration should follow this format:
### Labels are uncategorized strings, randomly colored
### Tags are key-value groups. You can optionally customize the background and font color of keys using HEX values.

labels:
  - # insert strings here
tags:
  fooBar: # is a key
    # bgColor: '#000000' (Optional)
    # color: '#FFFFFF' (Optional)
    values:
      - # insert value for fooBar as needed
      - # insert value for fooBar as needed
To ensure valid YAML, quotes are necessary if using special characters like # % & so on. Spaces between words will be valid without quotes.
For example, the following YAML is valid:
tags:
  my new key:
    values:
    - tag1
  demo:
    values:
    - space is fine
    - '& need quotes'
After editing the YAML click the "Save" button to commit the changes, then close the YAML editor when you're done.
You can remove or add tags to resources by clicking either the "Tags" table cell or on the drawer for editing a resource. You can also type on search field to filter the tags list.
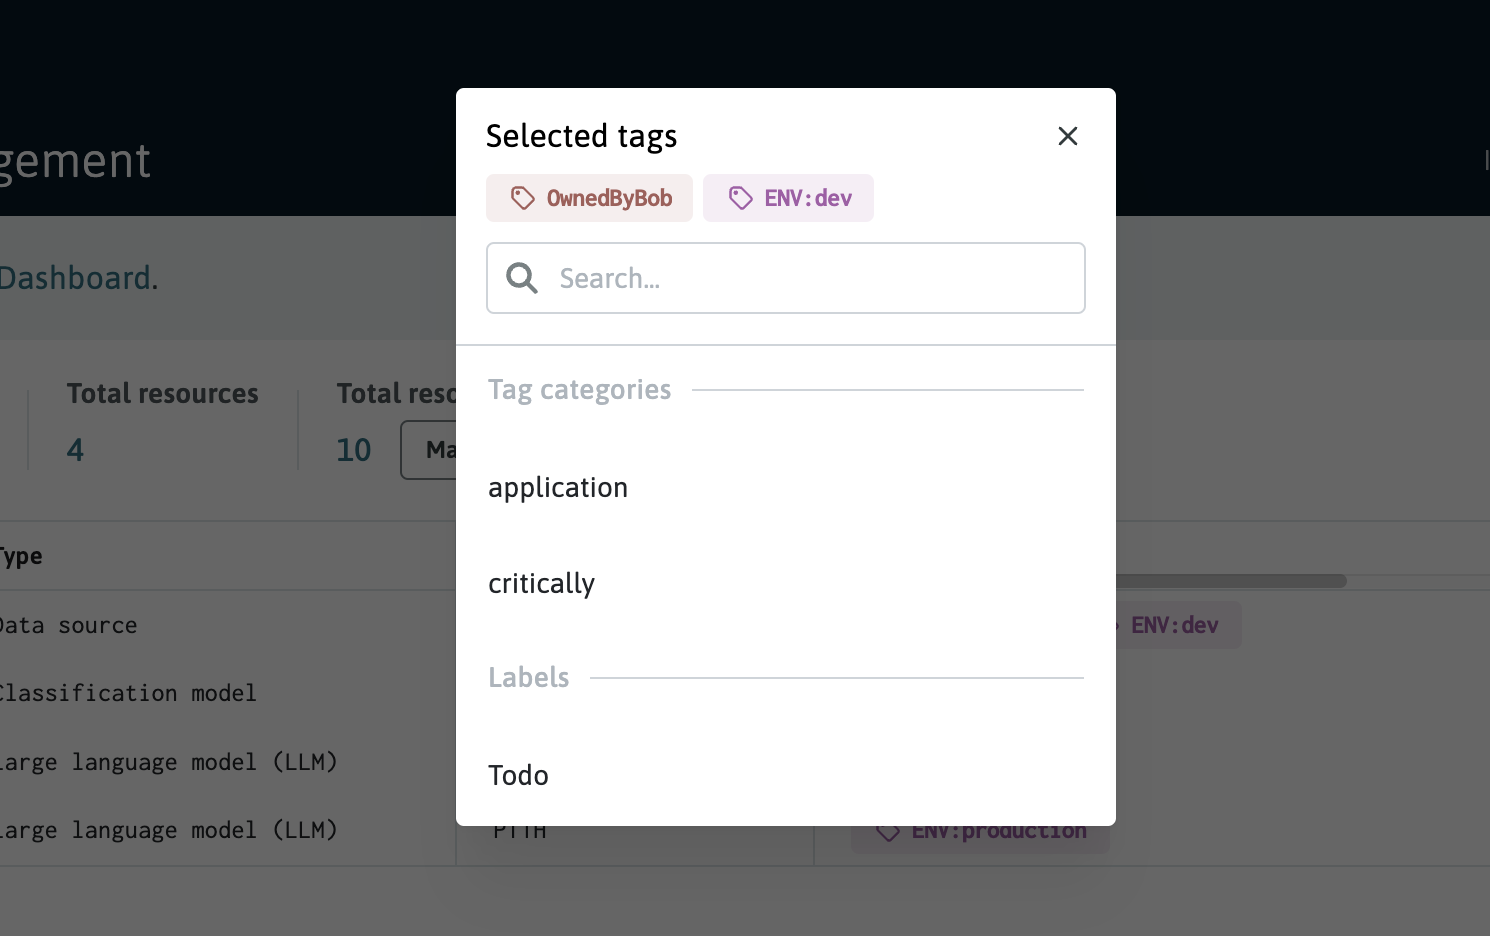 The tags selector displayed after clicking the "Tags" table cell
Notifications
WhyLabs Platform allows receiving regular updates about the state of your data via one of the supported messaging integrations (e.g. Slack, email, etc). These notifications include a summary of the data quality anomalies, and allow you to keep tabs on your data health metrics without having to manually check in on them in the Platform.
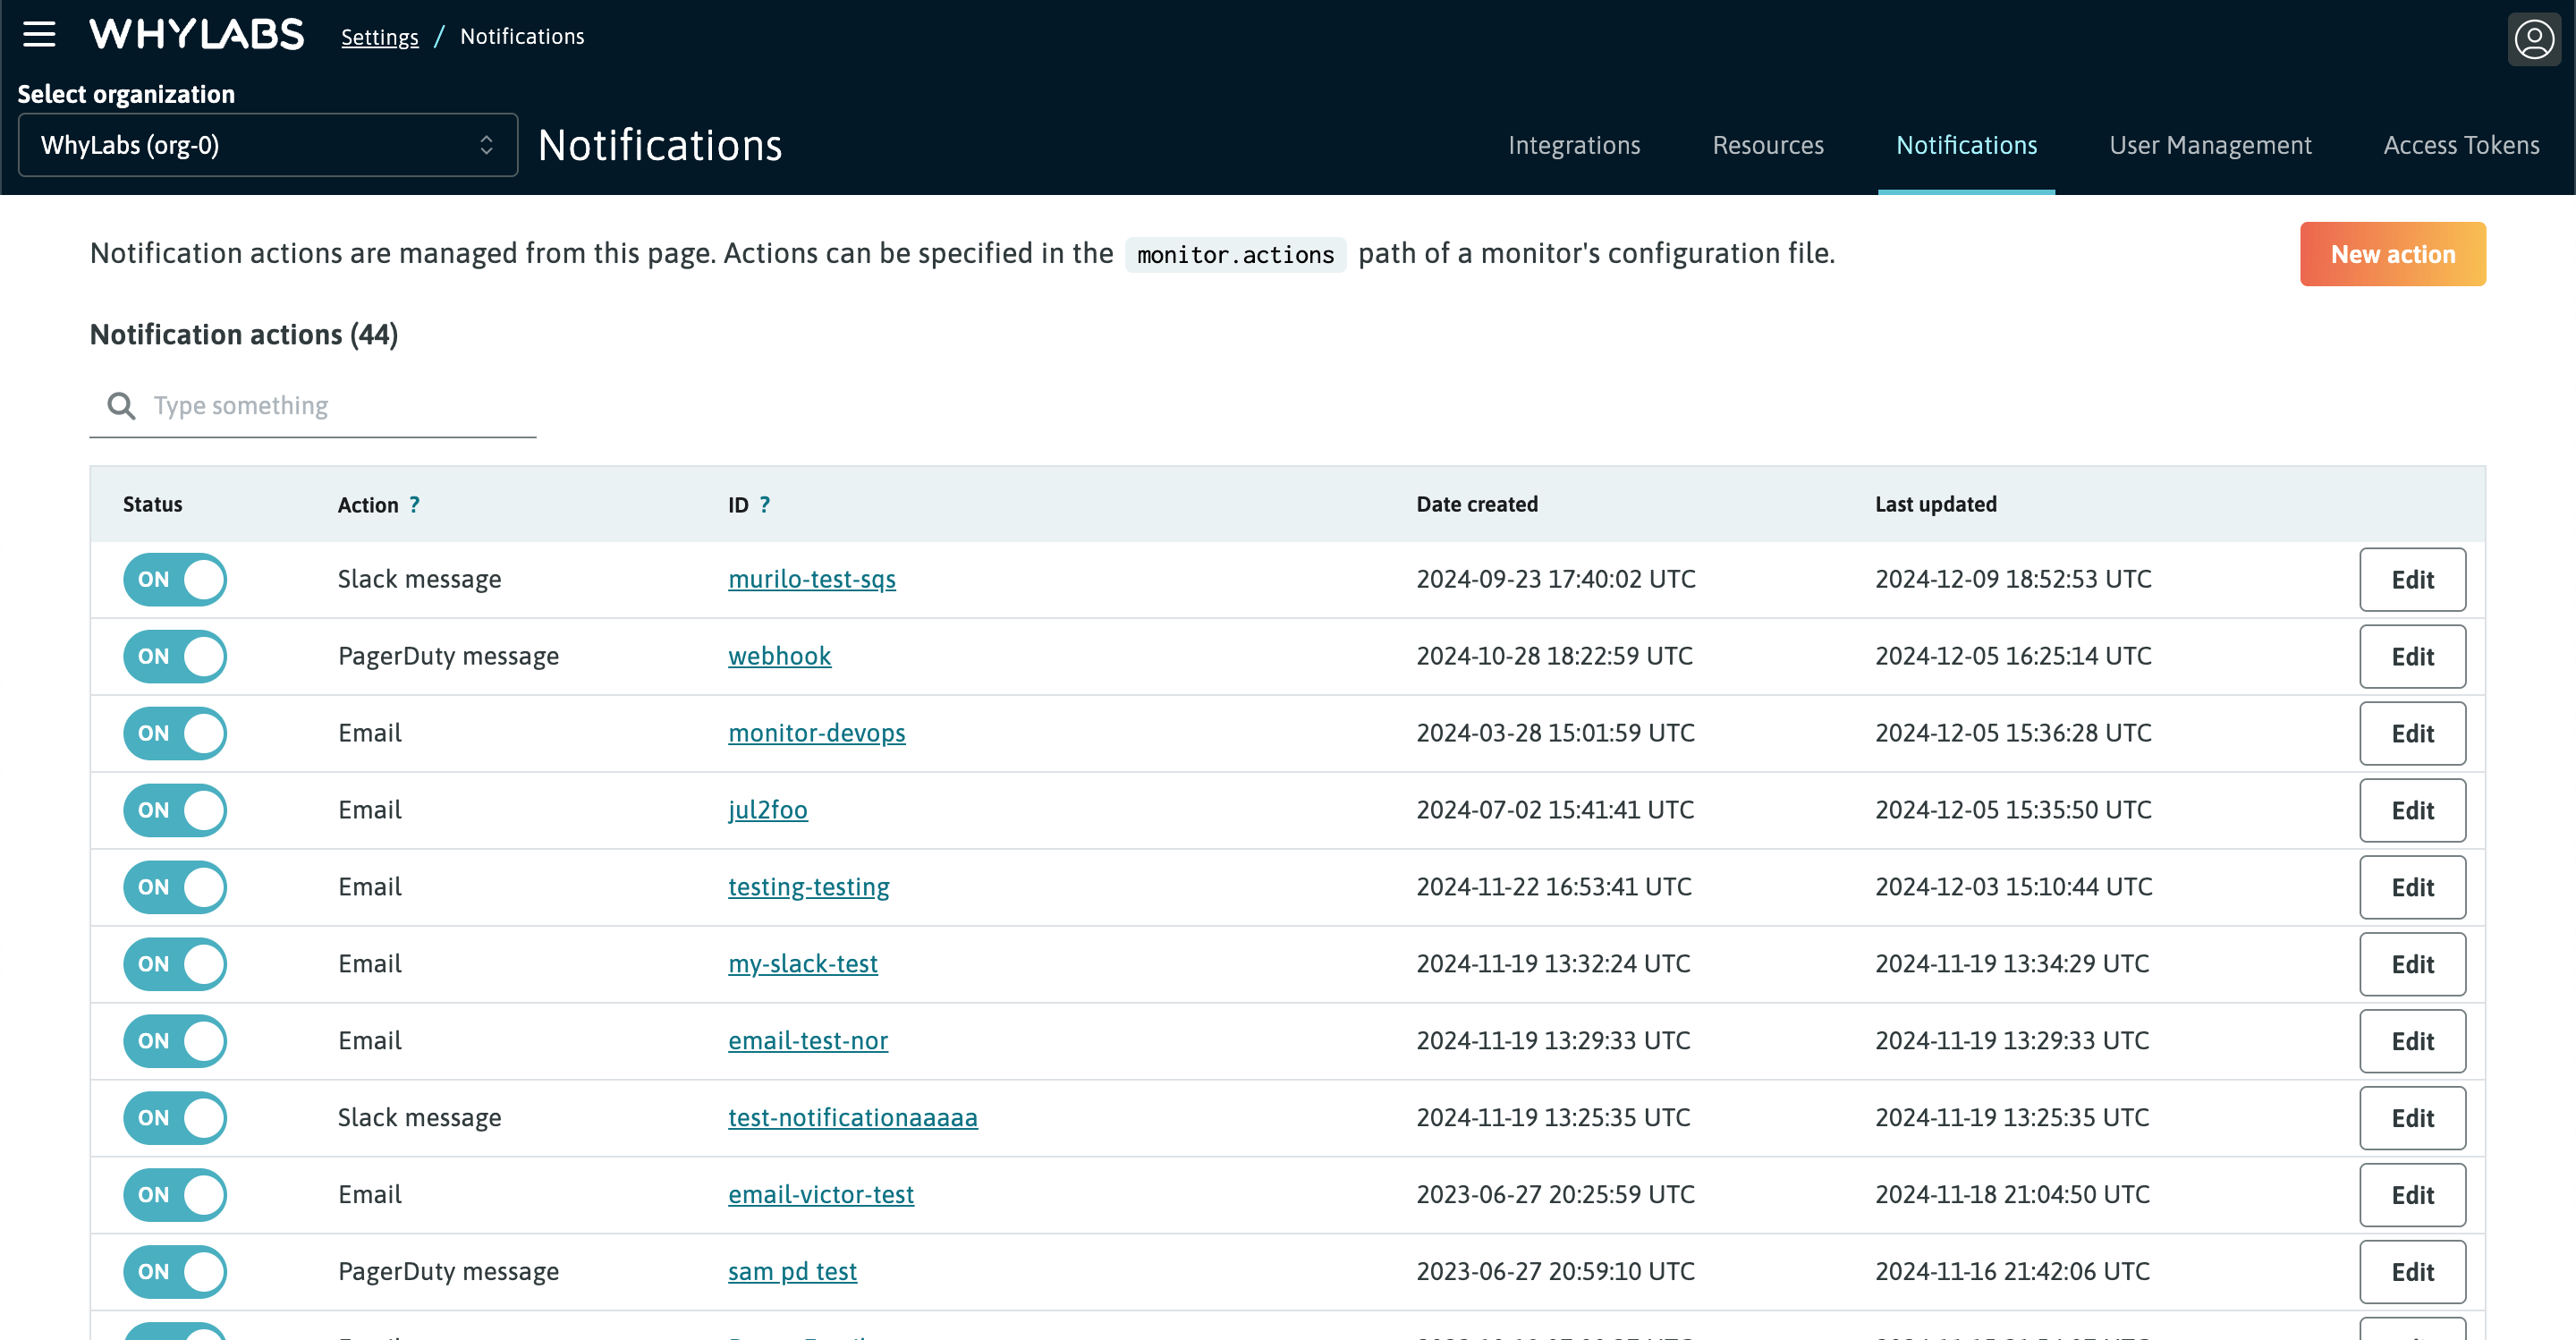
After clicking on a notification action, we can see the monitors that are triggering it, grouped at resource (model or dataset) level. This page also allows us to send a test notification to make sure the integration has been set up correctly.
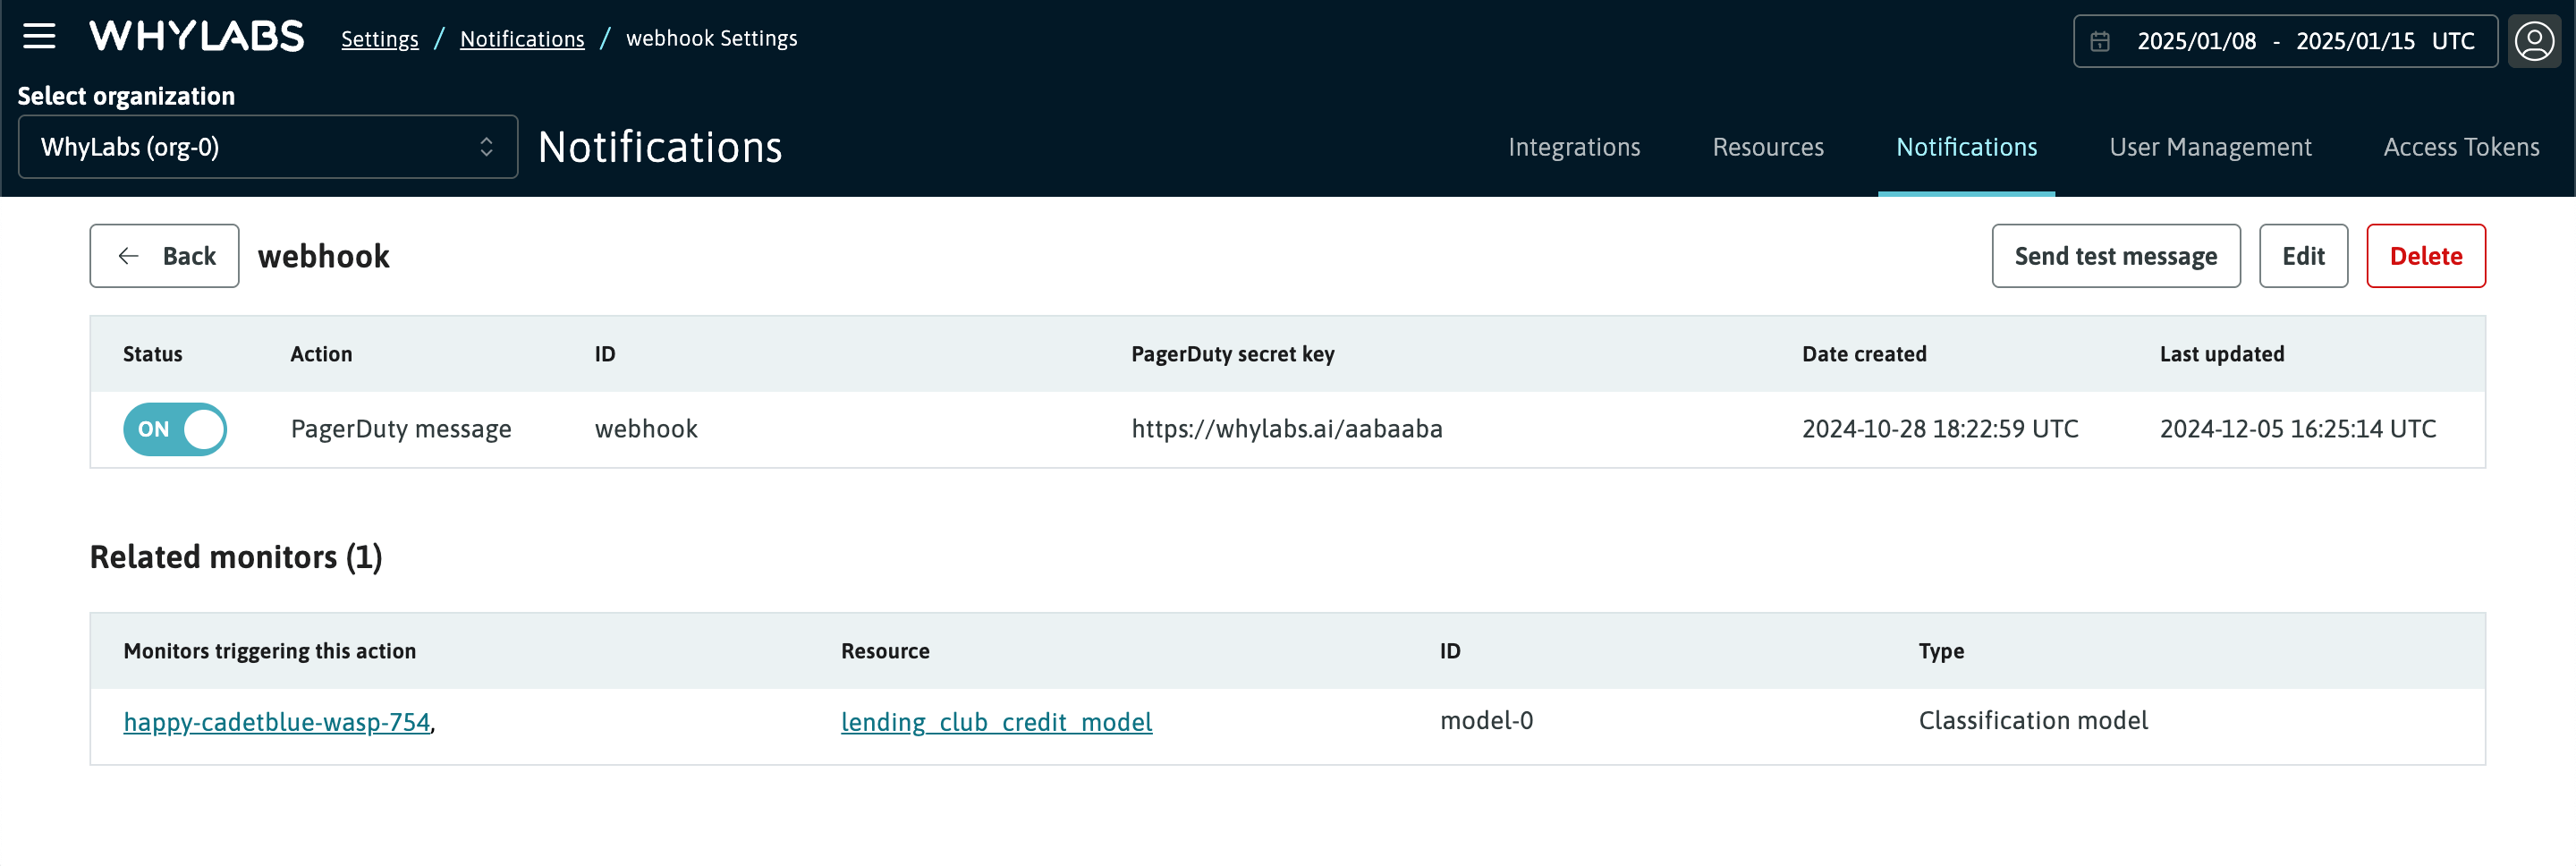
See Notifications and actions for more detail on managing notifications.
User Management
You define who gets access to your organization's data on WhyLabs. The platform makes it easy to add and remove users, enabling you to have full control over which team members can observe and monitor your data and ML model health metrics.
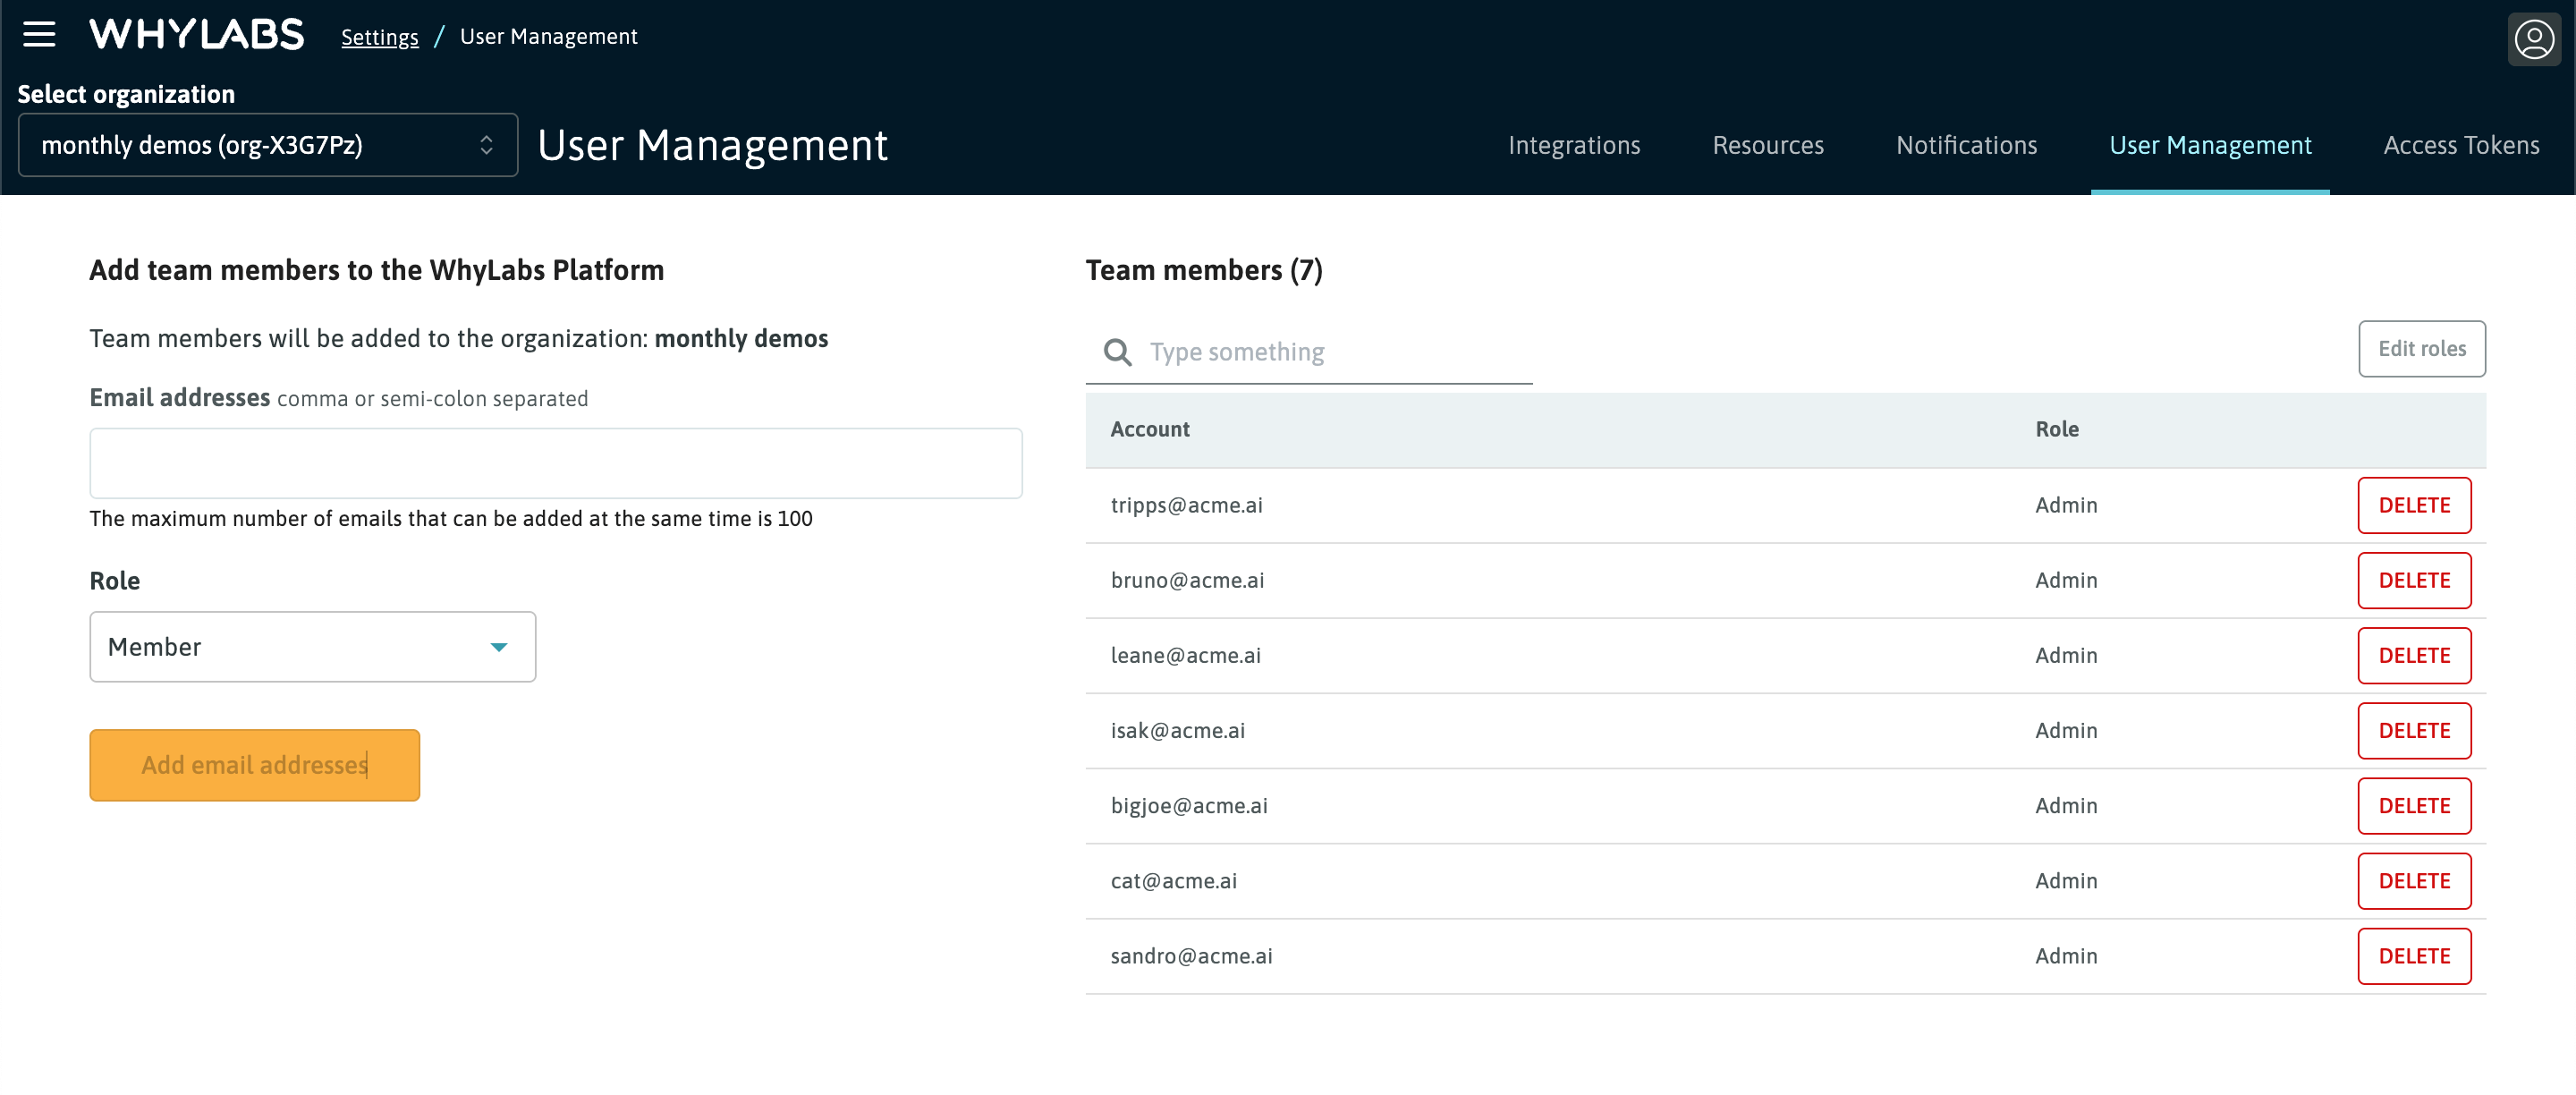
Role-Based Access Controls (RBAC)
From the User Management page, Enterprise customers can attached permission based roles to users added to their organization. The platform supports the following user roles:
- Admin: can manage all aspect of the platform's functionality including creation of API tokens and user management
- Member: read-only access with the ability to create and manage monitors
- Viewer: read-only access
See Role-based Access Control (RBAC) for more details.
Access Tokens
Access to the WhyLabs API is controlled via Access Tokens. Uploading data and interacting with our platform via direct API calls requires a valid token. These tokens are managed by each organization's administrator.
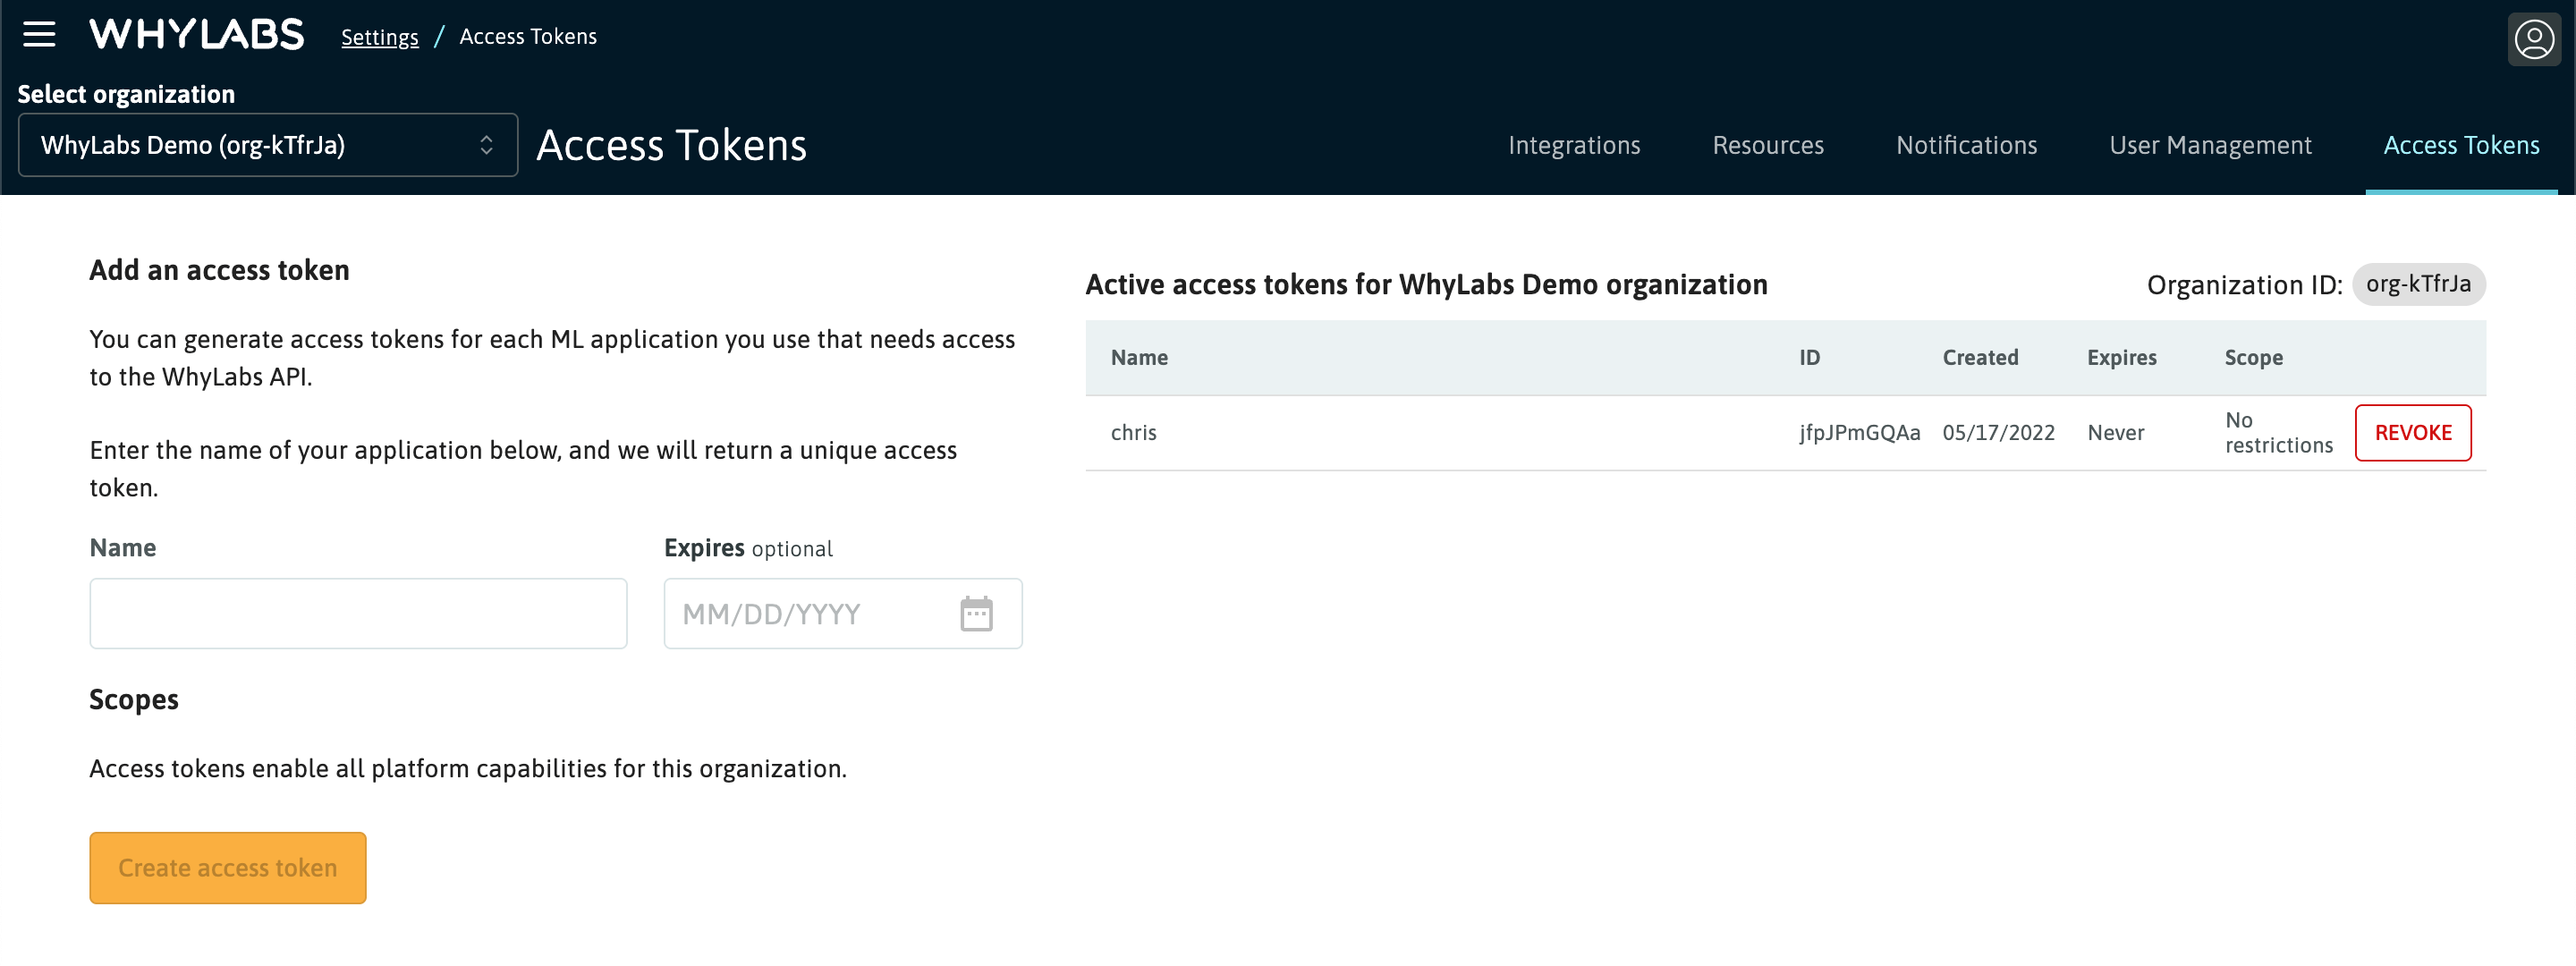
Admins can create tokens and optionally set an expiration date for these tokens. Admins also have the ability to revoke existing tokens.
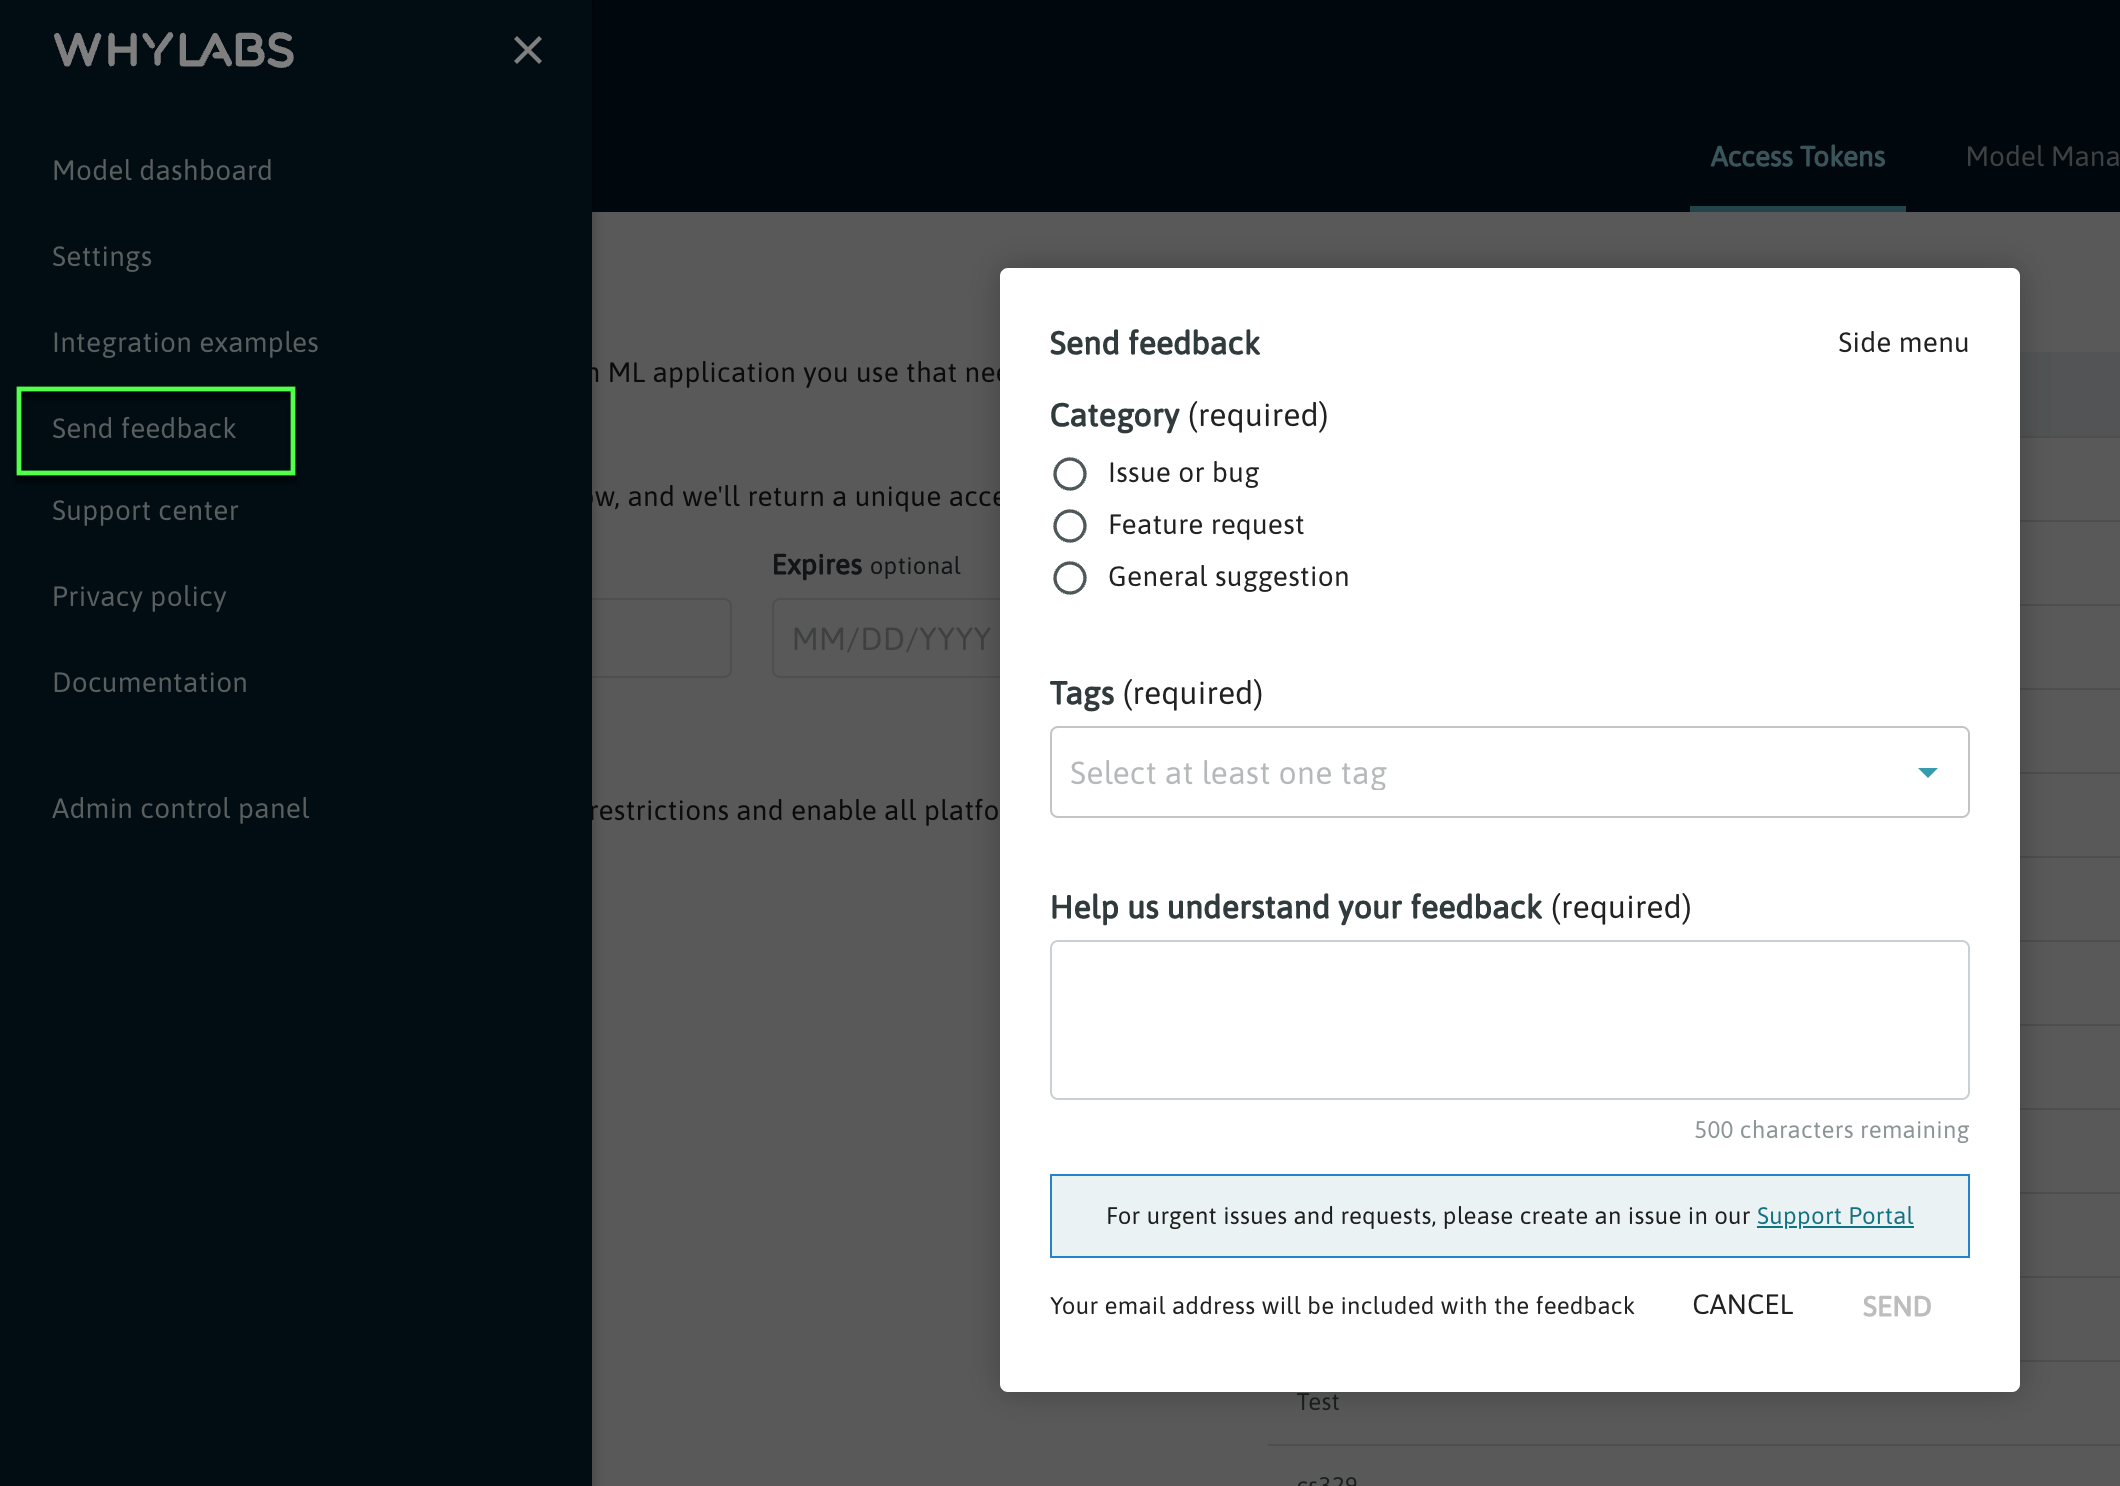
Other
Send feedback / Support Center
Users can submit support requests from directly within the WhyLabs Platform.
Privacy policy
Users can access the WhyLabs Privacy Policy from directly within the WhyLabs Platform.
Documentation
Users can access the documentation you’re reading now directly from the WhyLabs Platform 🙂

