Profile Overview
Introduction
Profiles are statistical summaries of datasets produced as a result of data logging with the whylogs open source library. The WhyLabs Platform is custom built to ingest and monitor these statistical summaries.
Profiles have three properties that make them ideal for observability and monitoring use cases: they are efficient, customizable, and mergeable. whylogs profiling can be performed on all types of data including tabular, images, text, and embeddings. Profiles are then sent to the WhyLabs Platform to enable observability and to be monitored.
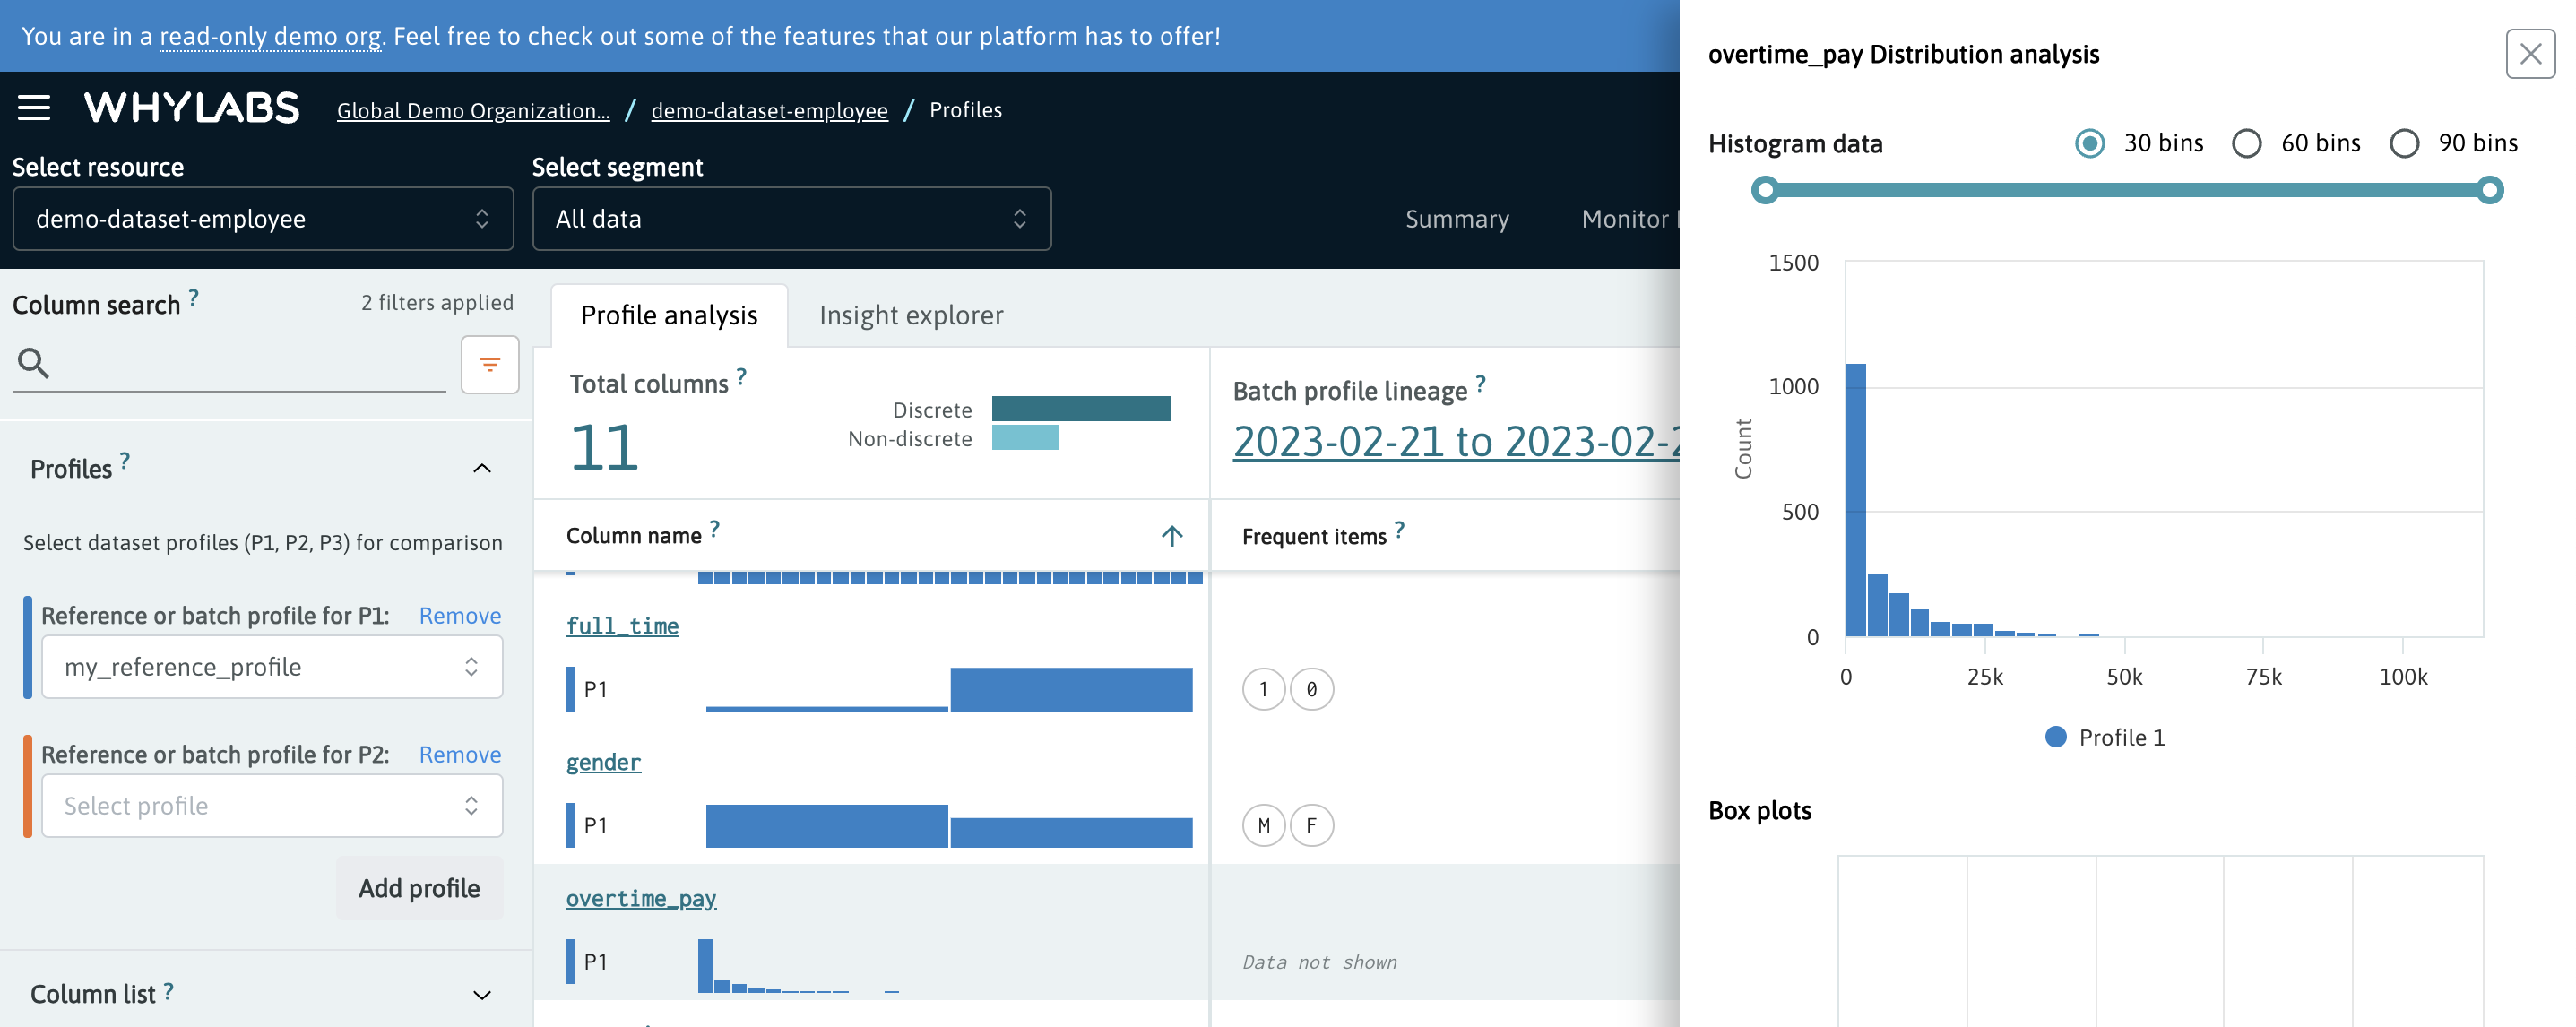 The Profile page in WhyLabs that enables analysis of the profile data
What are profiles
whylogs profiles are the core of the whylogs library. They capture key statistical properties of data, such as the distribution (far beyond simple mean, median, and standard deviation measures), the number of missing values, and a wide range of configurable custom metrics. By capturing these summary statistics, we are able to accurately represent the data and enable all of the use cases described in the introduction.
whylogs profiles have three properties that make them ideal for data logging: they are efficient, customizable, and mergeable.
Efficient: whylogs profiles efficiently describe the dataset that they represent. This high fidelity representation of datasets is what enables whylogs profiles to be effective snapshots of the data. They are better at capturing the characteristics of a dataset than a sample would be—as discussed in our Data Logging: Sampling versus Profiling blog post—and are very compact.
Customizable: The statistics that whylogs profiles collect are easily configured and customizable. This is useful because different data types and use cases require different metrics, and whylogs users need to be able to easily define custom trackers for those metrics. It’s the customizability of whylogs that enables our text, image, and other complex data trackers.
Mergeable: One of the most powerful features of whylogs profiles is their mergeability. Mergeability means that whylogs profiles can be combined together to form new profiles which represent the aggregate of their constituent profiles. Typically the merged profiles are roughly the same size as the original constituent profiles, which allows for an efficient reduce step in any map/reduce system. This enables logging for distributed and streaming systems, and allows users to view aggregated data across any time granularity at scales.
How you generate profiles
Once whylogs is installed, it's easy to generate profiles in both Python and Java environments.
To generate a profile from a Pandas dataframe in Python, simply run:
import whylogs as why
import pandas as pd

# dataframe
df = pd.read_csv("path/to/file.csv")
results = why.log(df)
What you do with profiles
Once you’ve generated whylogs profiles, you can upload them to the WhyLabs Platform.
We distinguish two types of profiles on the platform: batch profiles and reference profiles. Below you can find the details of each type along with the relevant code snippets.
Batch profiles
Batch profiles are at the core of the WhyLabs platform. Representing production data at a given point in time, these profiles contain metrics that are used to populate the various dashboards. They are also analyzed by monitors to detect anomalies in the data. They get merged into buckets defined by the batch frequency selected for the given WhyLabs resource.
By default batch profiles are assigned the current timestamp, but it can also be set explicitly as shown below:
from datetime import datetime, timezone
timestamp = datetime.strptime("13-09-2024", "%d-%m-%Y").replace(tzinfo=timezone.utc)
results.set_dataset_timestamp(timestamp)
The whylogs Python API enables uploading batch profiles in two different ways:
- First option:
results.view().write()
- Second option:
from whylogs.api.writer.whylabs import WhyLabsWriter

writer = WhyLabsWriter()
writer.write(results)
Reference profiles
Reference profiles are suitable for storing data relevant to the given model, that isn't ingested as part of the production pipeline. As such, these profiles are referred to as "static" reference profiles, and unlike batch profiles they aren't mergeable or monitorable in WhyLabs.
The most common use case for reference profiles is to capture statistical summaries of the training, validation, or test sets. As a result, reference profiles are often used as baselines for data drift monitoring in the platform.
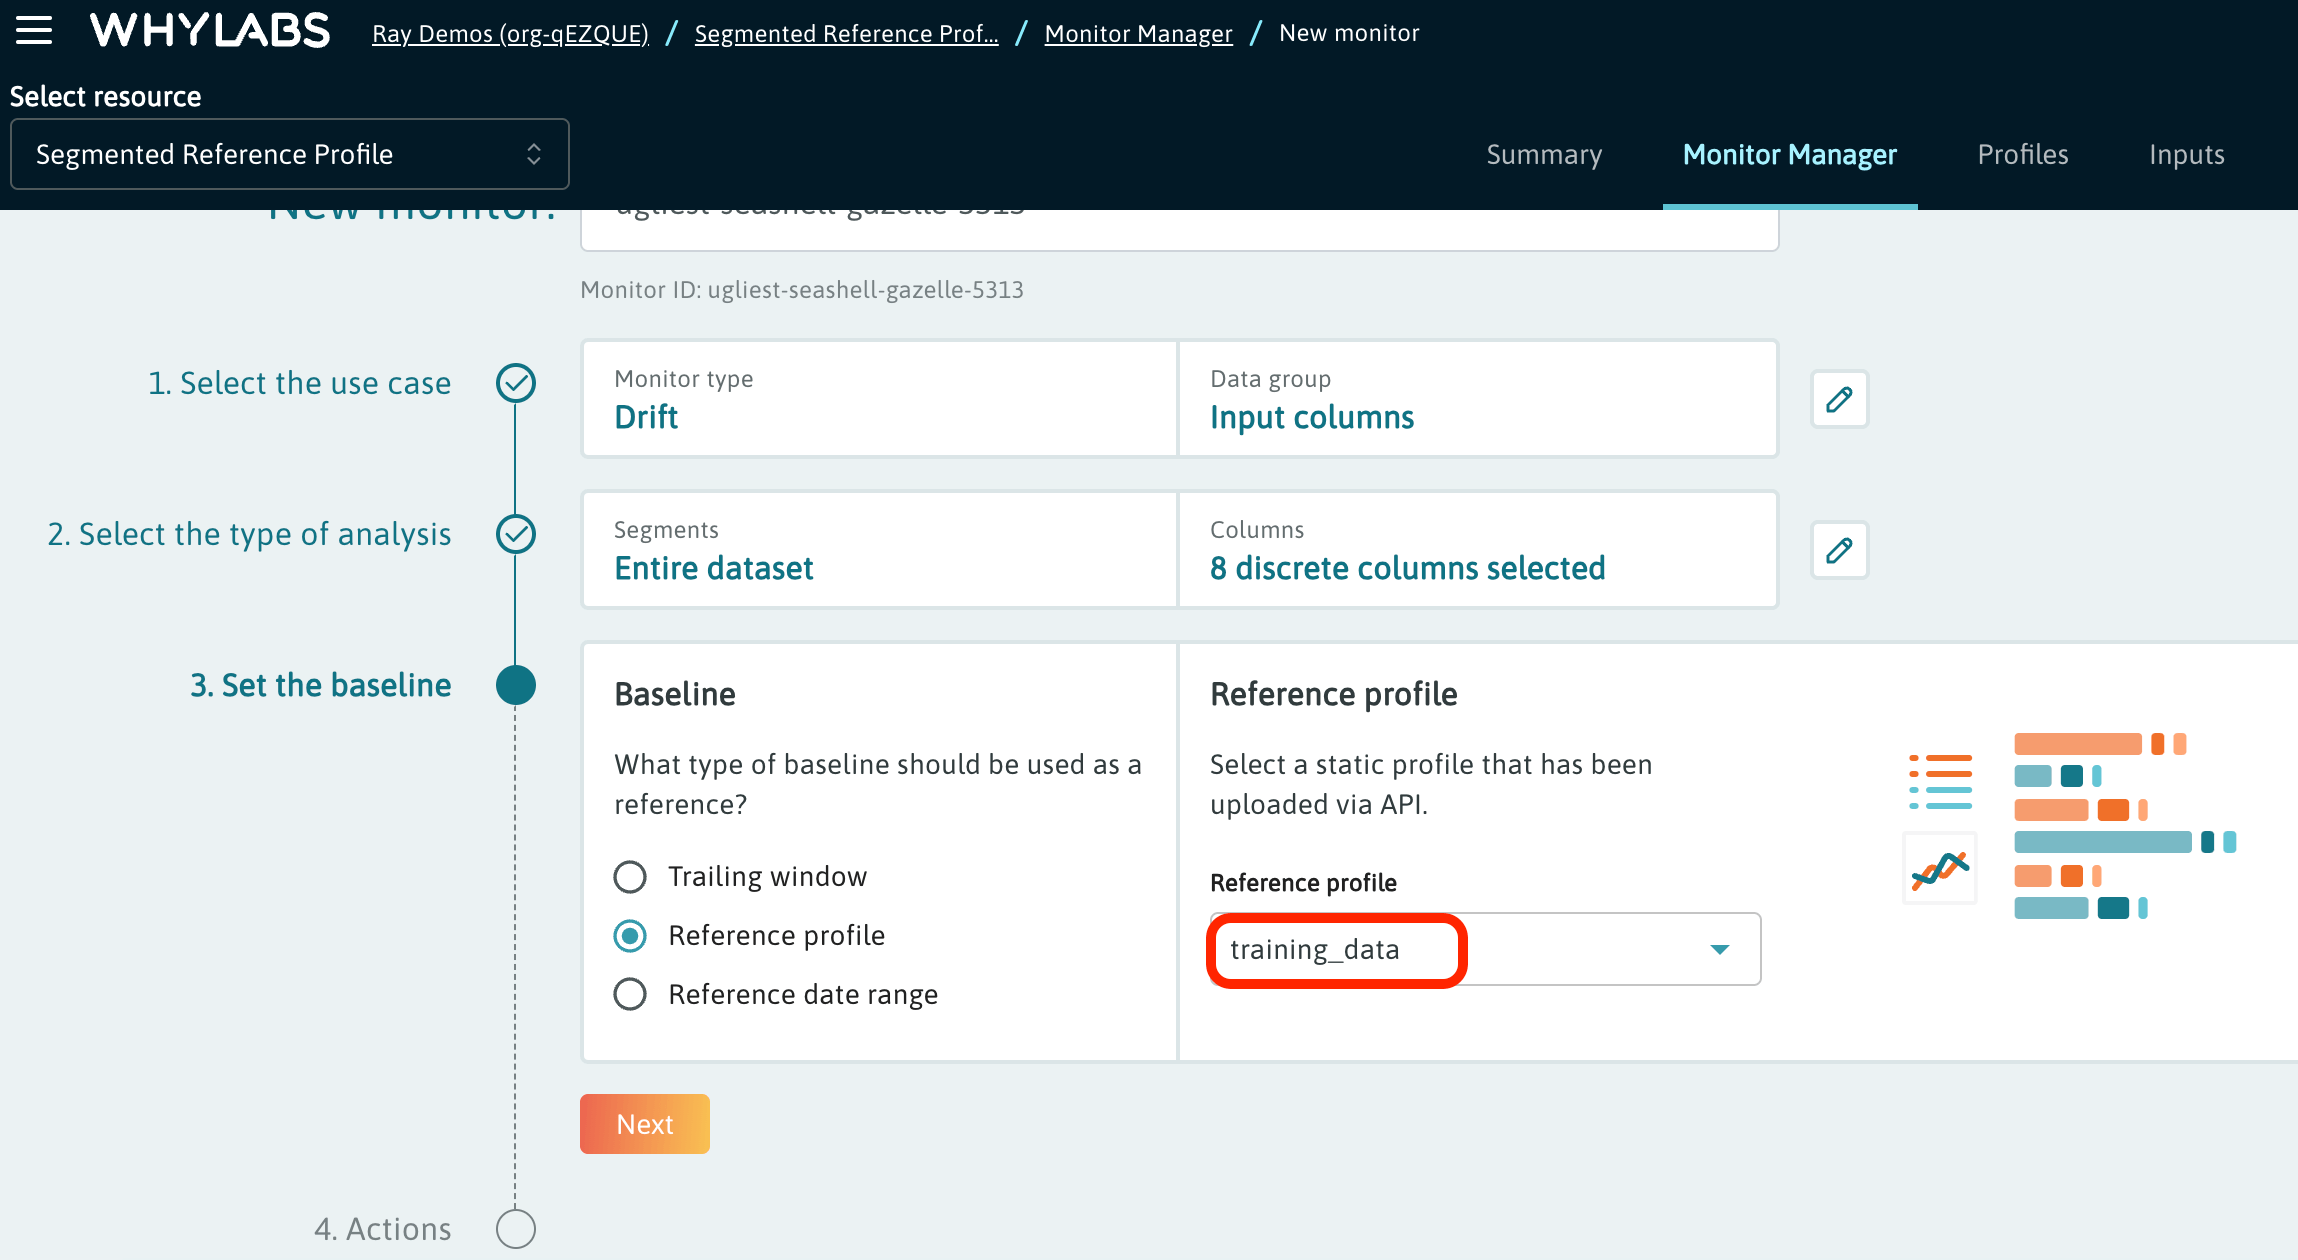 The reference profile can be selected as a monitor baseline.
To create a reference profile, pass an alias to the WhyLabsWriter object as shown below (notebook example here). This alias will be the identifier of the reference profile visible on the platform's Profiles page.
from whylogs.api.writer.whylabs import WhyLabsWriter

writer = WhyLabsWriter()
writer.option(reference_profile_name="my-reference-profile").write(results)
In case no reference_profile_name is provided, the data is written as a batch profile with the current timestamp.
After a successful upload, the reference profile can be inspected on the Profiles page as shown below:
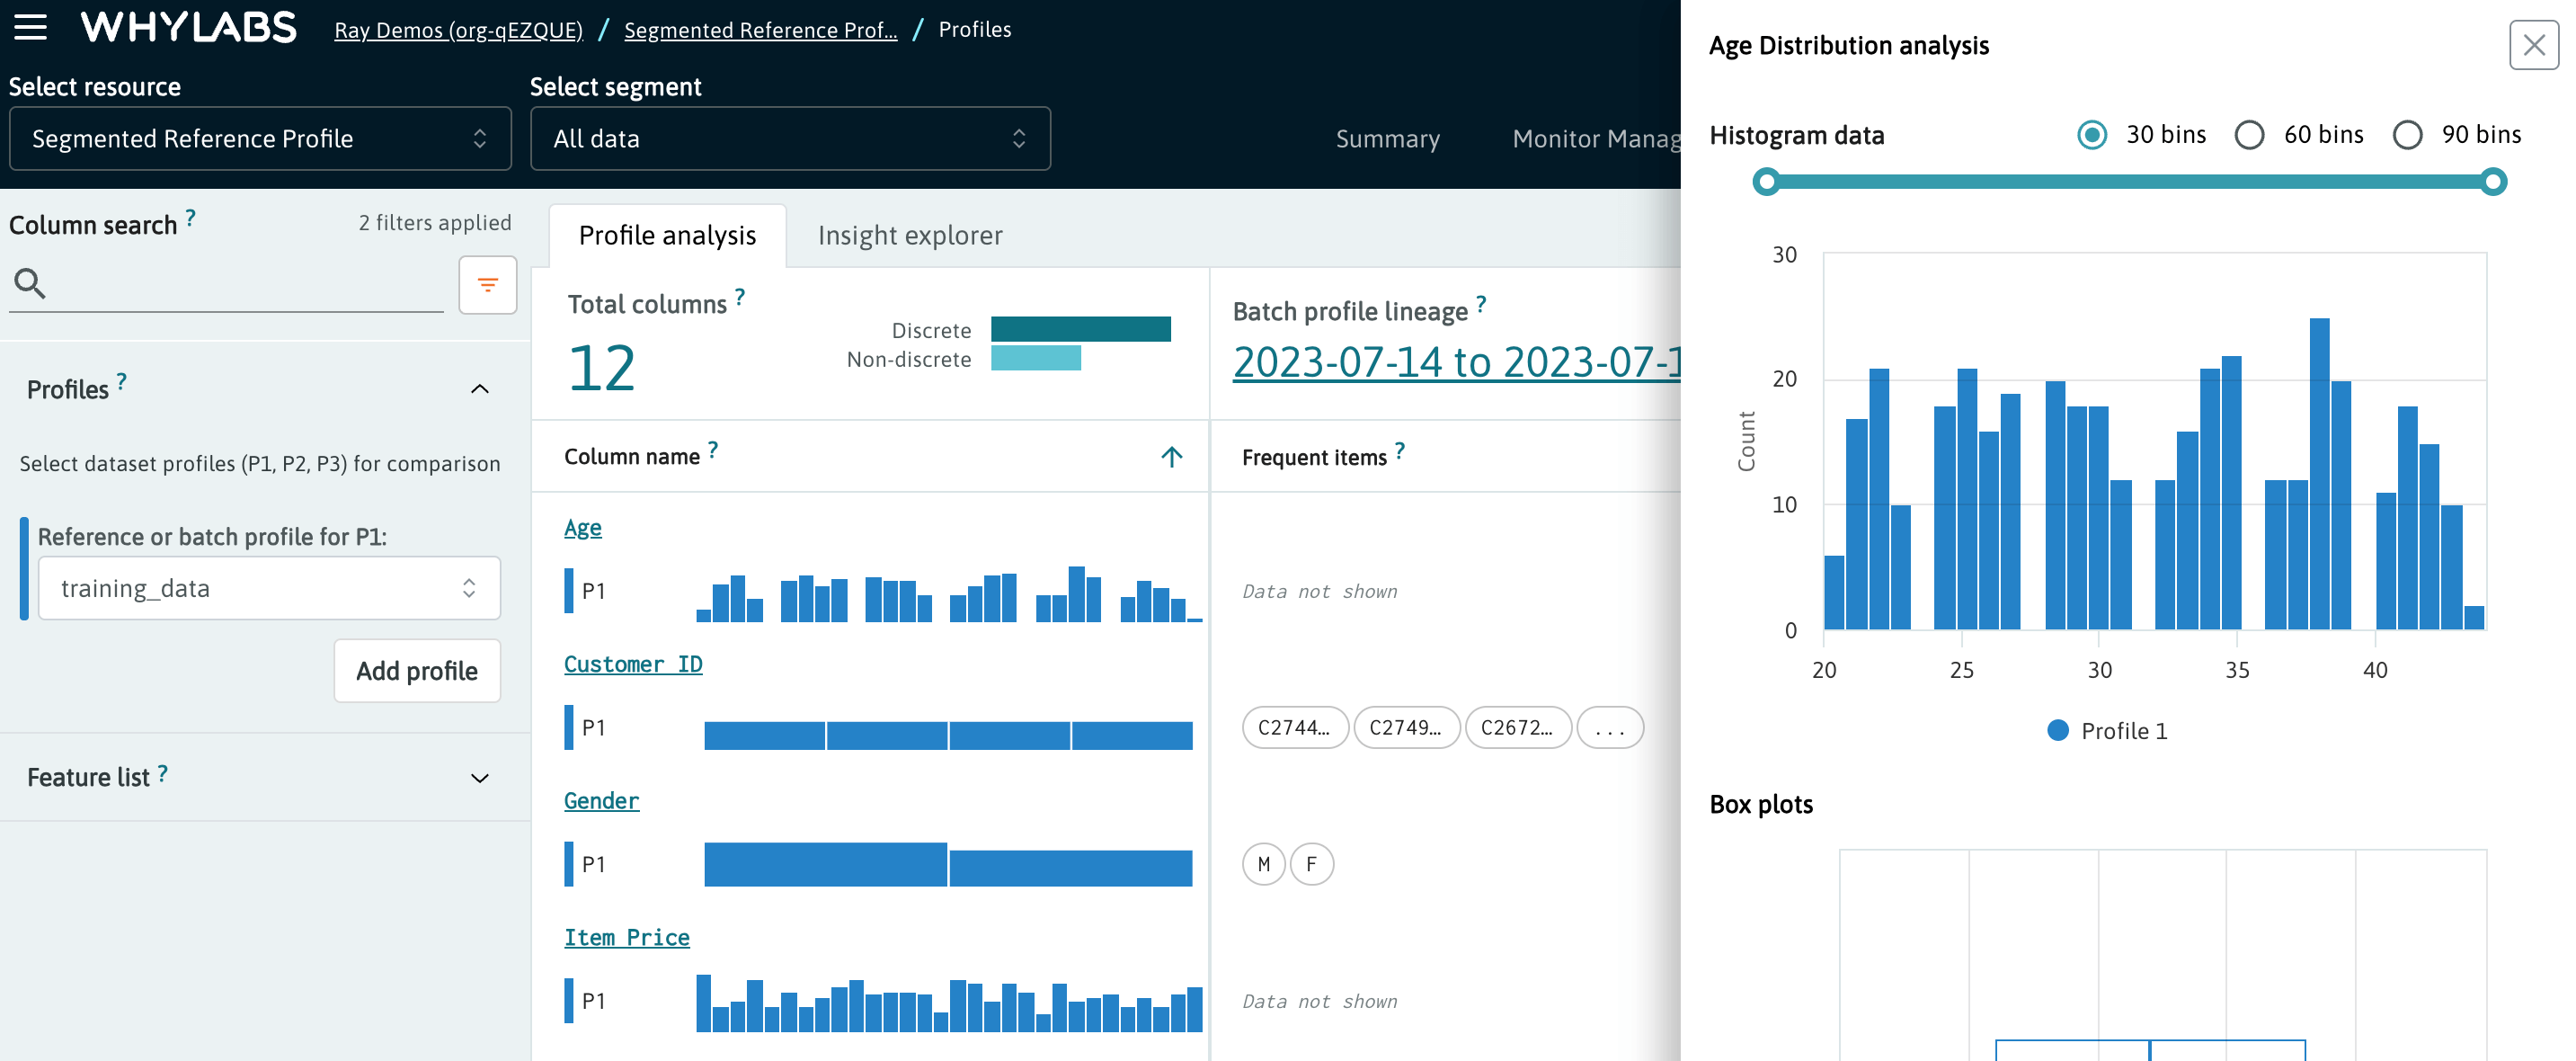 Reference profile inspected on the Profile Page
Deleting Profiles
Deleting Batch Profiles
Batch profiles can be deleted by calling the DeleteDatasetProfiles API. It's important to ensure the correct start and end time values are entered as UTC milliseconds timestamps. This conversion can be performed programmatically (see the Python code below) or by using an online timestamp converter.
from datetime import datetime

def datetime_to_timestamp(dt):
    epoch = datetime.utcfromtimestamp(0)
    return int((dt - epoch).total_seconds() * 1000)

# convert '11/28/2022, 20:00:00' to a unix timestamp
datetime_to_timestamp(datetime(2022, 11, 28, 20, 0, 0))
>>> 1669665600000
For example, if we need to delete all profiles from November 28, 2022 that were uploaded to model-123 in org-0, we should execute the following command:
curl -I -X 'DELETE' \
  'https://api.whylabsapp.com/v0/organizations/org-0/dataset-profiles/models/model-123?profile_start_timestamp=1669593600000&profile_end_timestamp=1669680000000' \
  -H 'accept: application/json' \
  -H 'X-API-Key: your-api-key-here'
The start timestamp denotes 11-28-2022 00:00:00, whereas the end timestamp - 11-29-2022 00:00:00. Again, it's crucial to remember that these timestamps refer to the UTC time zone.
Important to note:
- The
DeleteDatasetProfilesAPI won't work if any of the timestamps are fresher than one hour- Deletion requests are executed at the top of the hour and they may take up to an hour to complete, depending on the volume of data to be removed
The profile deletion can also be performed using our Python API client or via whylabs-toolkit.
Deleting Reference Profiles
To delete a reference profile you will need to call the DeleteReferenceProfile API and provide the reference profile ID visible on the Profiles page in the profile selection dropdown.
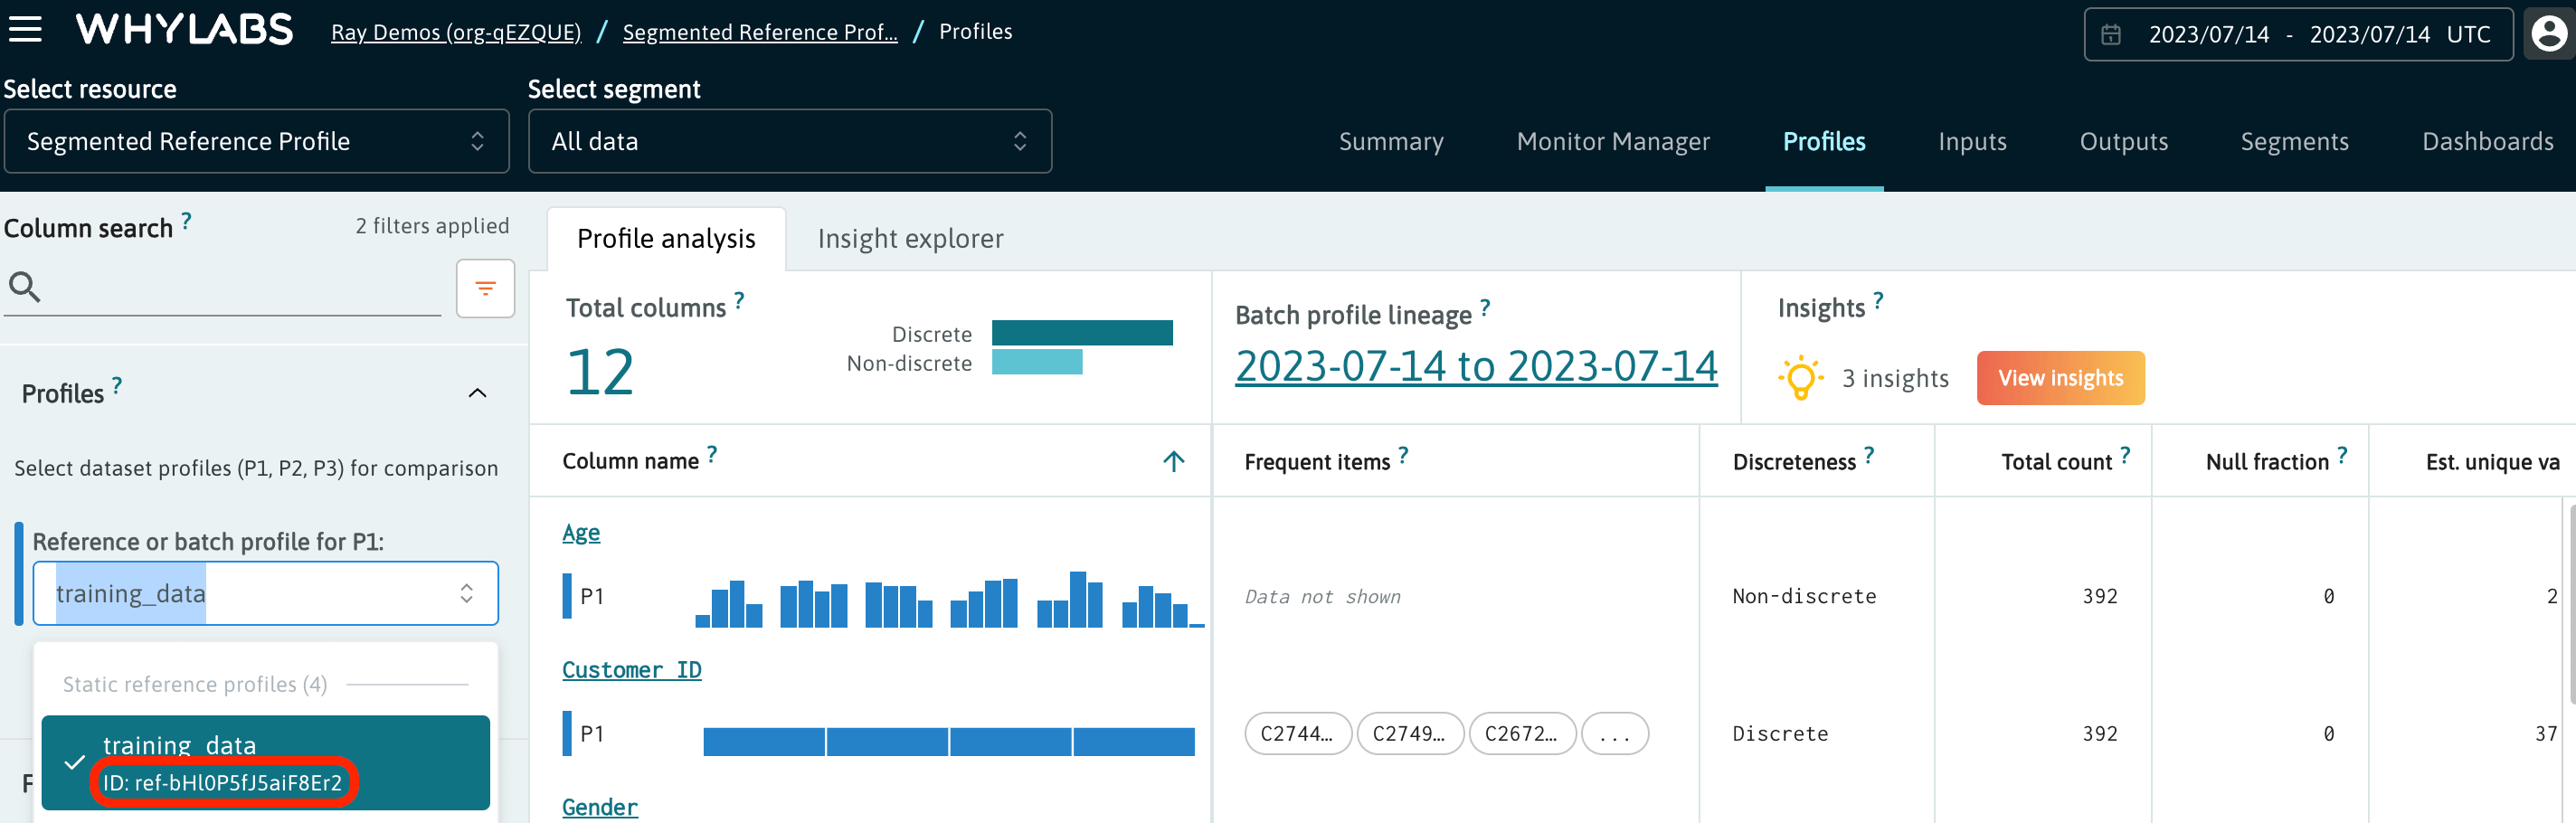 The reference profile ID is visible in the dropdown on the Profile Page
The DeleteReferenceProfile API can be called from a Python script like this.
Alternatively, it can be called from the shell as shown below:
curl -X 'DELETE' \
  'https://api.whylabsapp.com/v0/organizations/org-123/dataset-profiles/models/model-123/reference-profiles/ref-xxxxxx' \
  -H 'accept: application/json' \
  -H 'X-API-Key: your-api-key-here'
Overwriting Profiles
To overwrite a profile you will first need to delete the given profile, wait until the next hour to have it removed and then upload the data for the same timestamp. The deletion instructions are listed here.
After the deletion of the unwanted profiles you can re-upload the corrected data for this period. To ensure the backfill will happen with the next monitor run, please check if the backfillGracePeriodDuration in your analyzer config specifies a sufficient time period to cover the deleted profile. You can find more details about this parameter on this documentation page.
To suppress any notifications related to past anomalies identified during the backfill, please add the datasetTimestampOffset parameter to your monitor configuration as described in our documentation here.

