Profile Comparison
When troubleshooting alerts, it’s often helpful to perform a detailed comparison of 2 or 3 profiles against each other. The profile comparison feature allows users to do just that. This can be accessed from the “Profile” tab when inspecting a specific model or dataset.

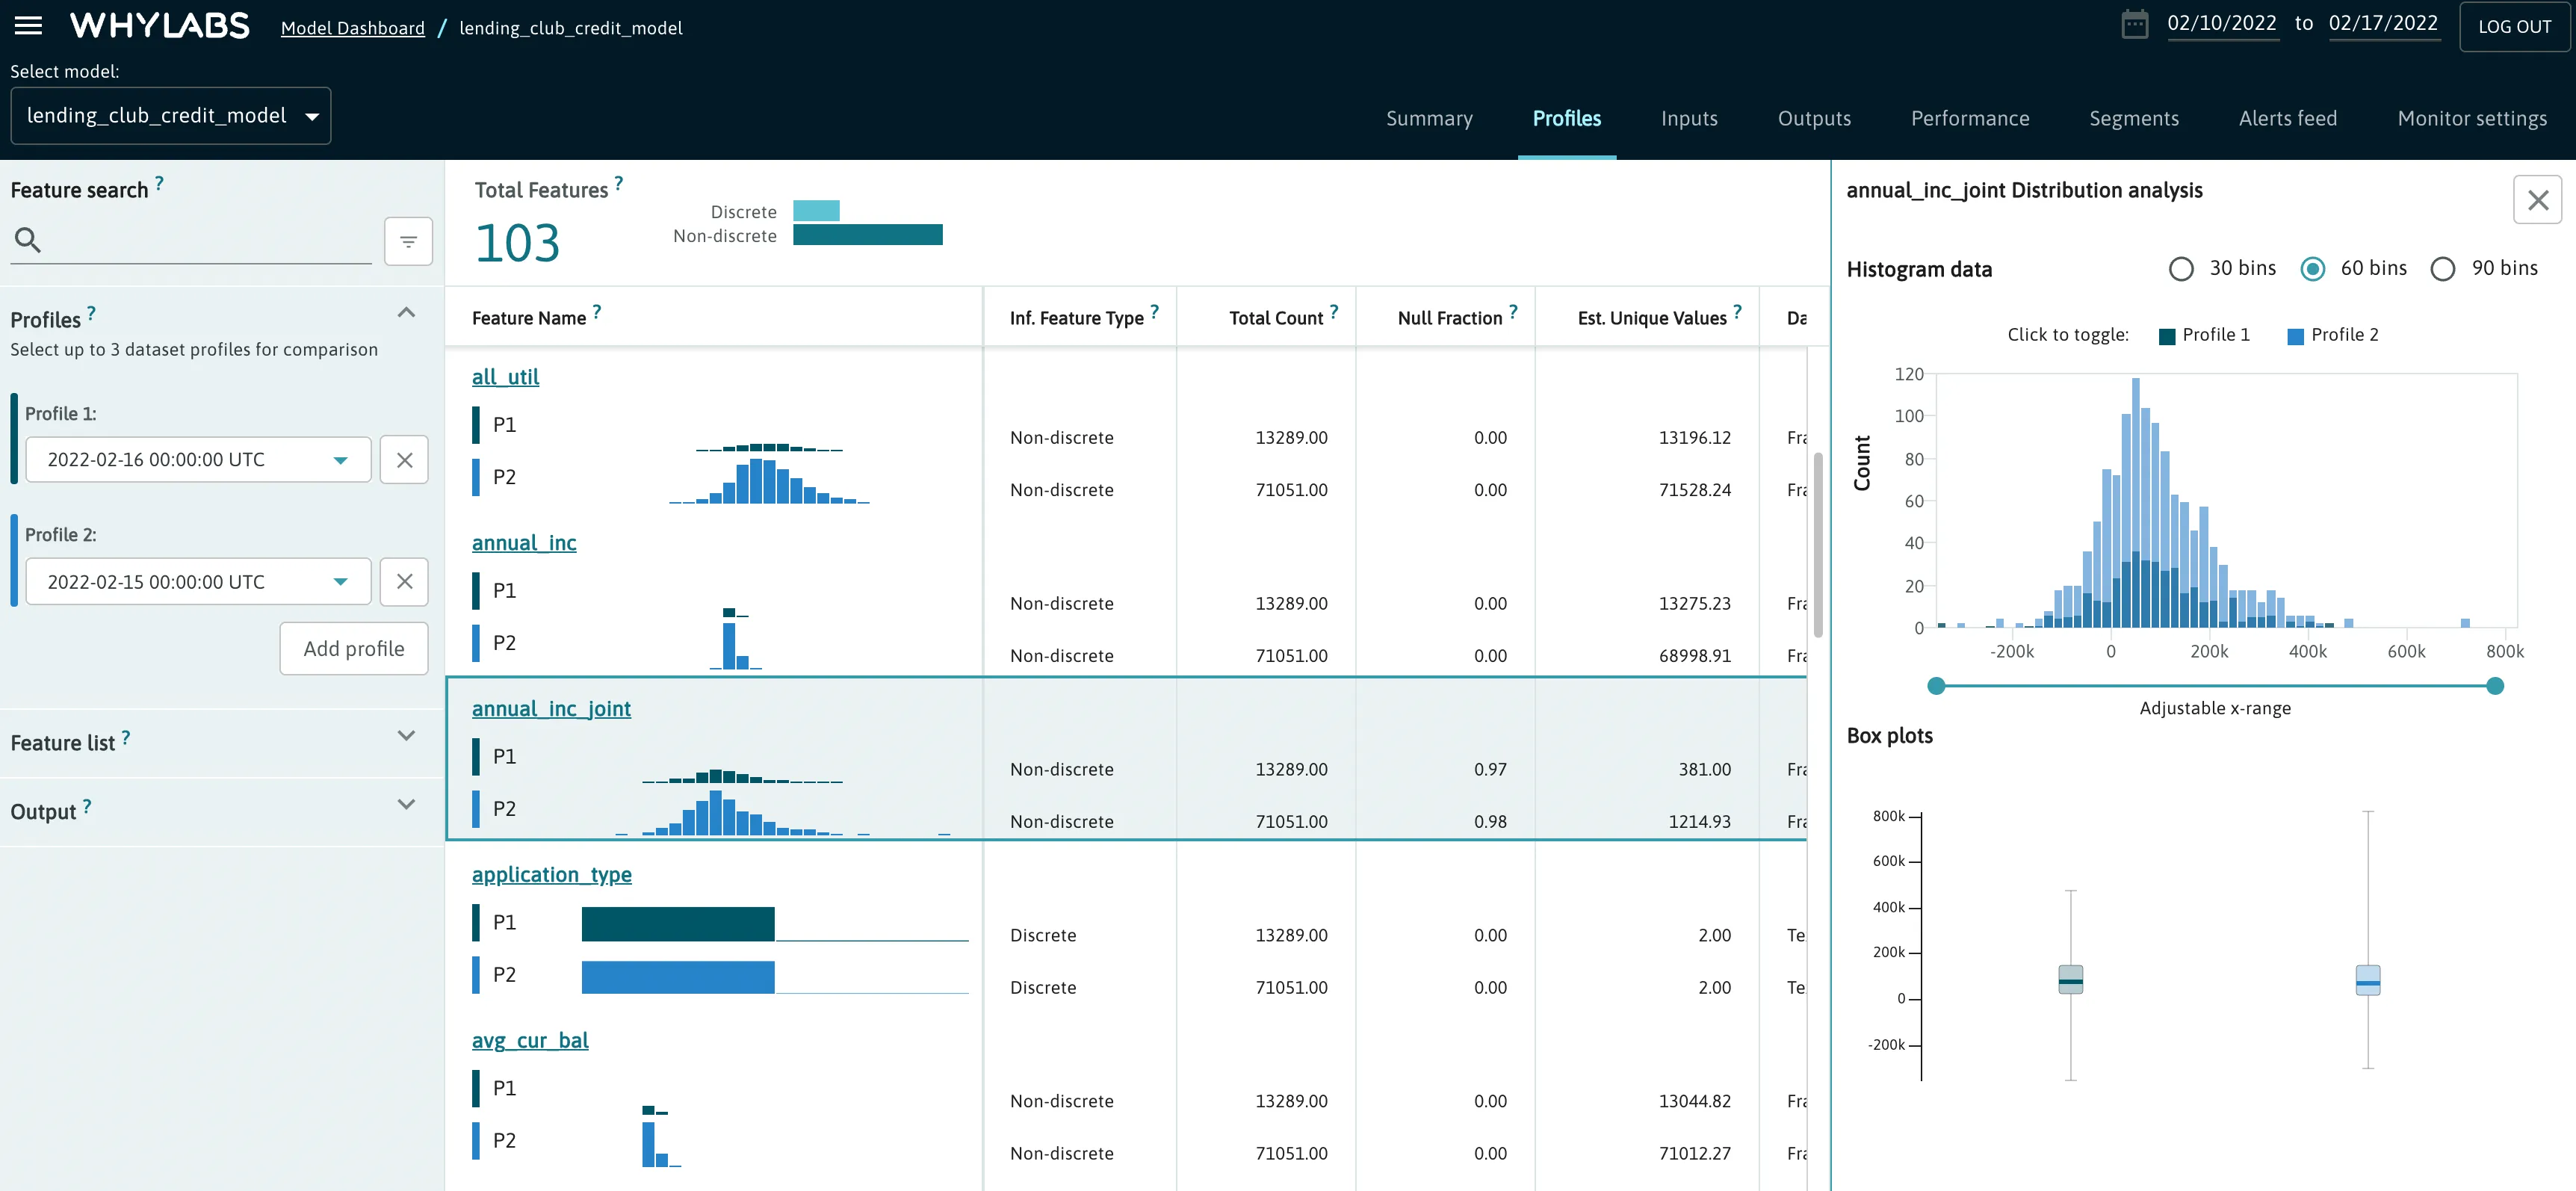
Users can select up to 3 profiles for comparison. Users will see the distributions of each feature stacked on top of each other for each profile. For each feature, users will be able to directly compare a variety of descriptive statistics pertaining to each profile being compared.
Users can click on “view details” when hovering over a set of distributions for an overlaid view of each priofile’s distribution along with most frequent items (as seen on right side of above image). Within this view, users can hide/unhide distributions, adjust the domain, and change the bin size.
It should be noted that multiple profiles uploaded to with the same timestamp will automatically be merged within the platform. For instance, suppose a user is logging profiles for a distributed data pipeline, and they upload 10 different profiles for partial datasets for December 8th. When selecting the December 8th profile in the profile comparison feature, users will be seeing the merged profile from all of these sub-profiles.
The profile comparison feature supports both numeric and categorical features. See the videos below for how to use the profile comparison view for troubleshooting alerts for each of these data types.

