Anomalies
Once a user sets up monitors for a project, WhyLabs will begin to automatically detect anomalies accordingly for newly uploaded profiles. Anomalies can be divided into the following groups:
- Data Drift - Anomalies resulting from a sufficiently high distribution distance between current distributions and the chosen baseline
- Data Quality - Anomalies may be in relation to cardinality, missing values, or schema
- Performance - Anomalies can be in relation to a variety of performance metrics for either classification or regression models
- Integration Health - Anomalies are triggered when no profiles have been uploaded to a model for some period of time configured by the user
Anomalies are created when thresholds for the associated monitor are exceeded. These thresholds will depend on how the user has configured the analysis type and baseline in the Monitor Manager.
These anomalies can be viewed within the platform, but users can also configure notifications to be sent via one or more communication channels when such anomalies are detected. Check out Notification Workflows documentation for more information.
Viewing Anomalies in the Platform
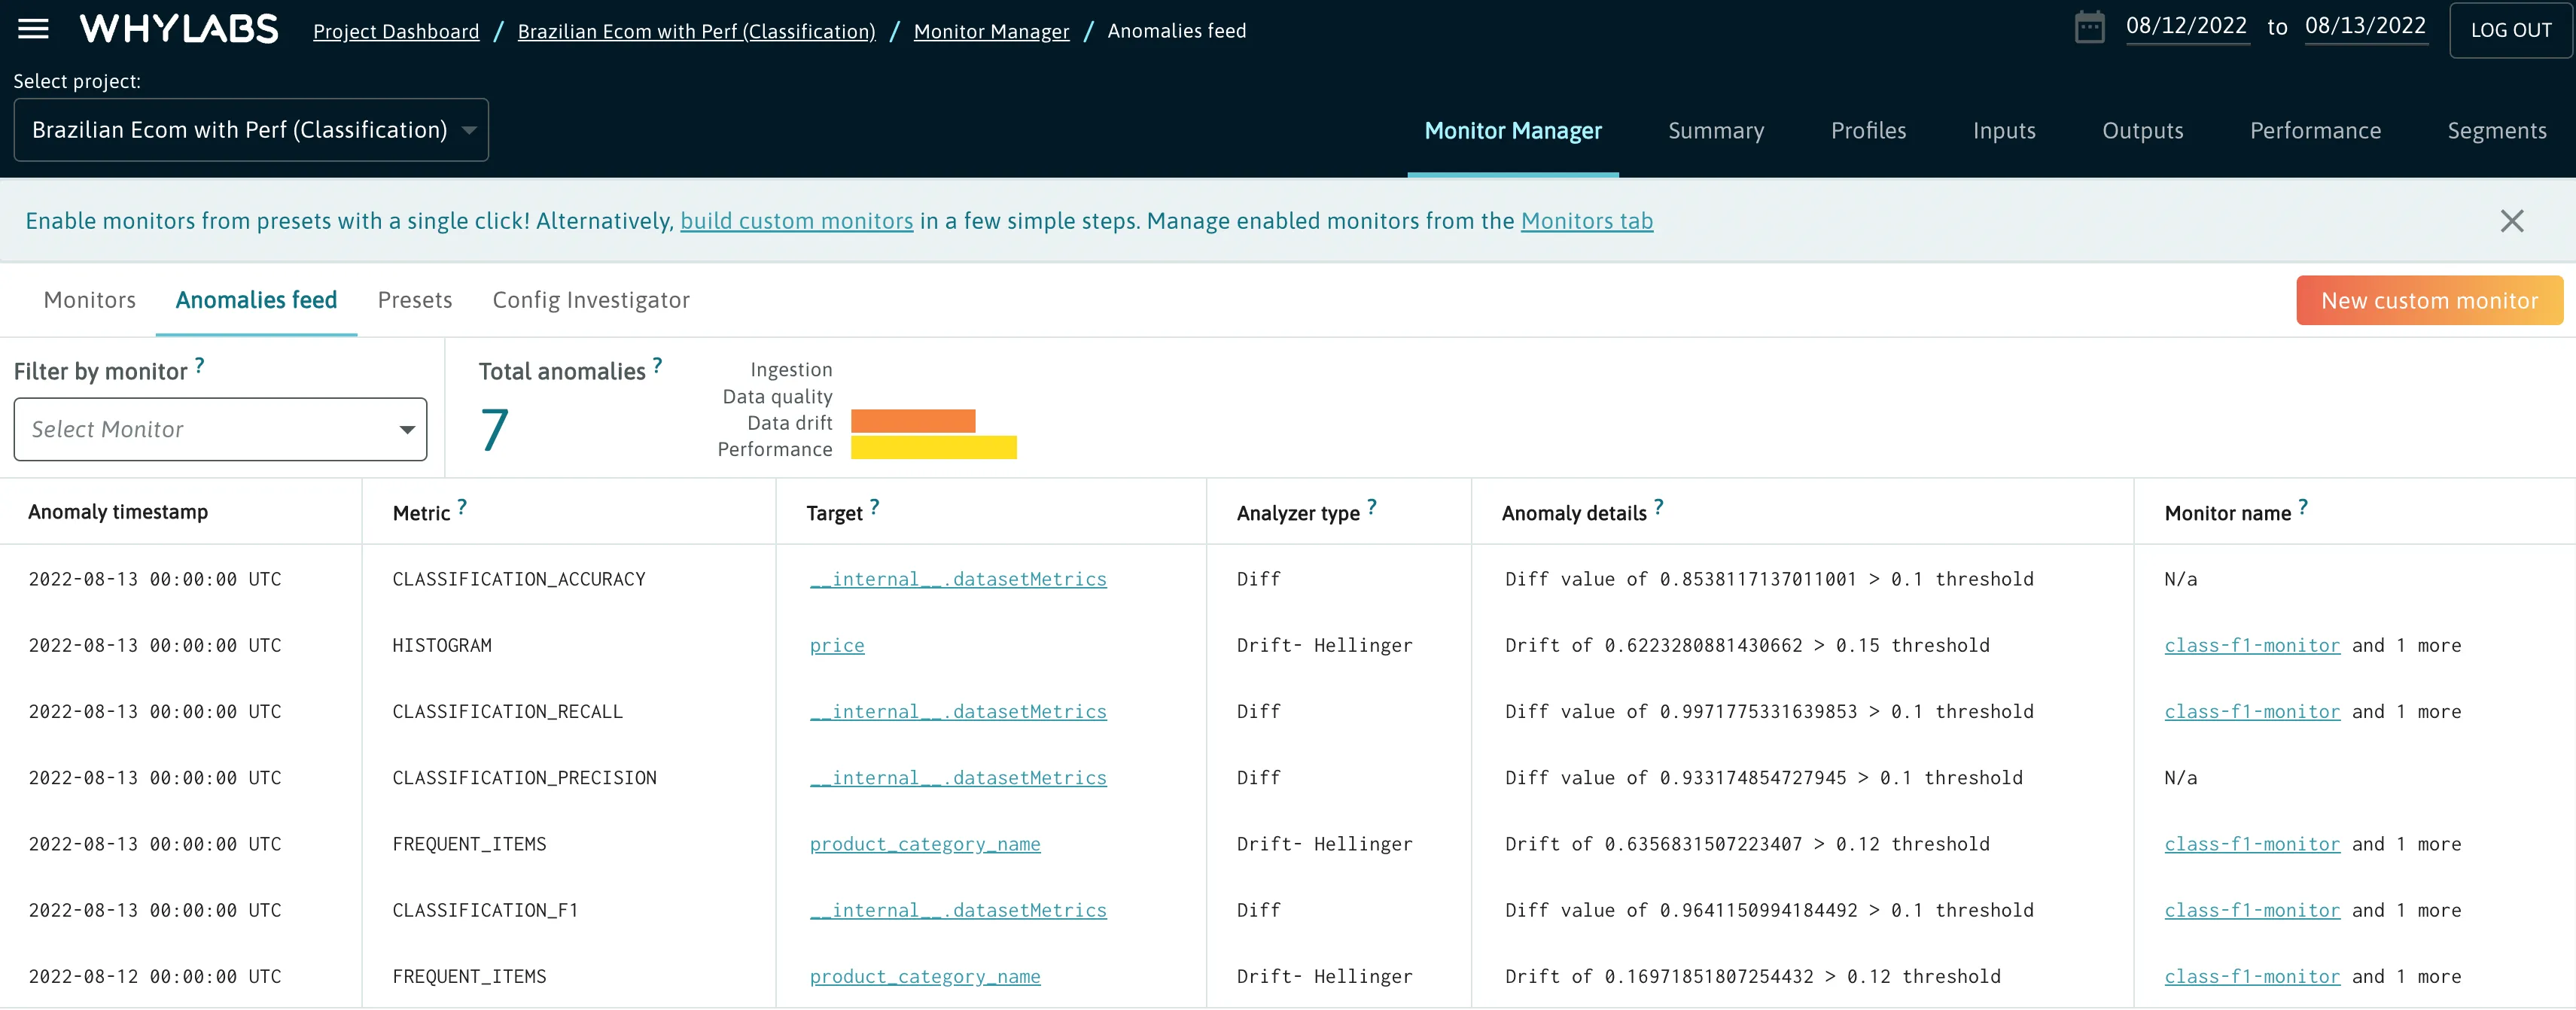
Within the Monitor Manager, users can view a list of all anomalies associated with a project for the selected date range using the Anomaly Feed. This also includes a summary broken down by anomaly type. Users can optionally filter this list by a specific monitor.
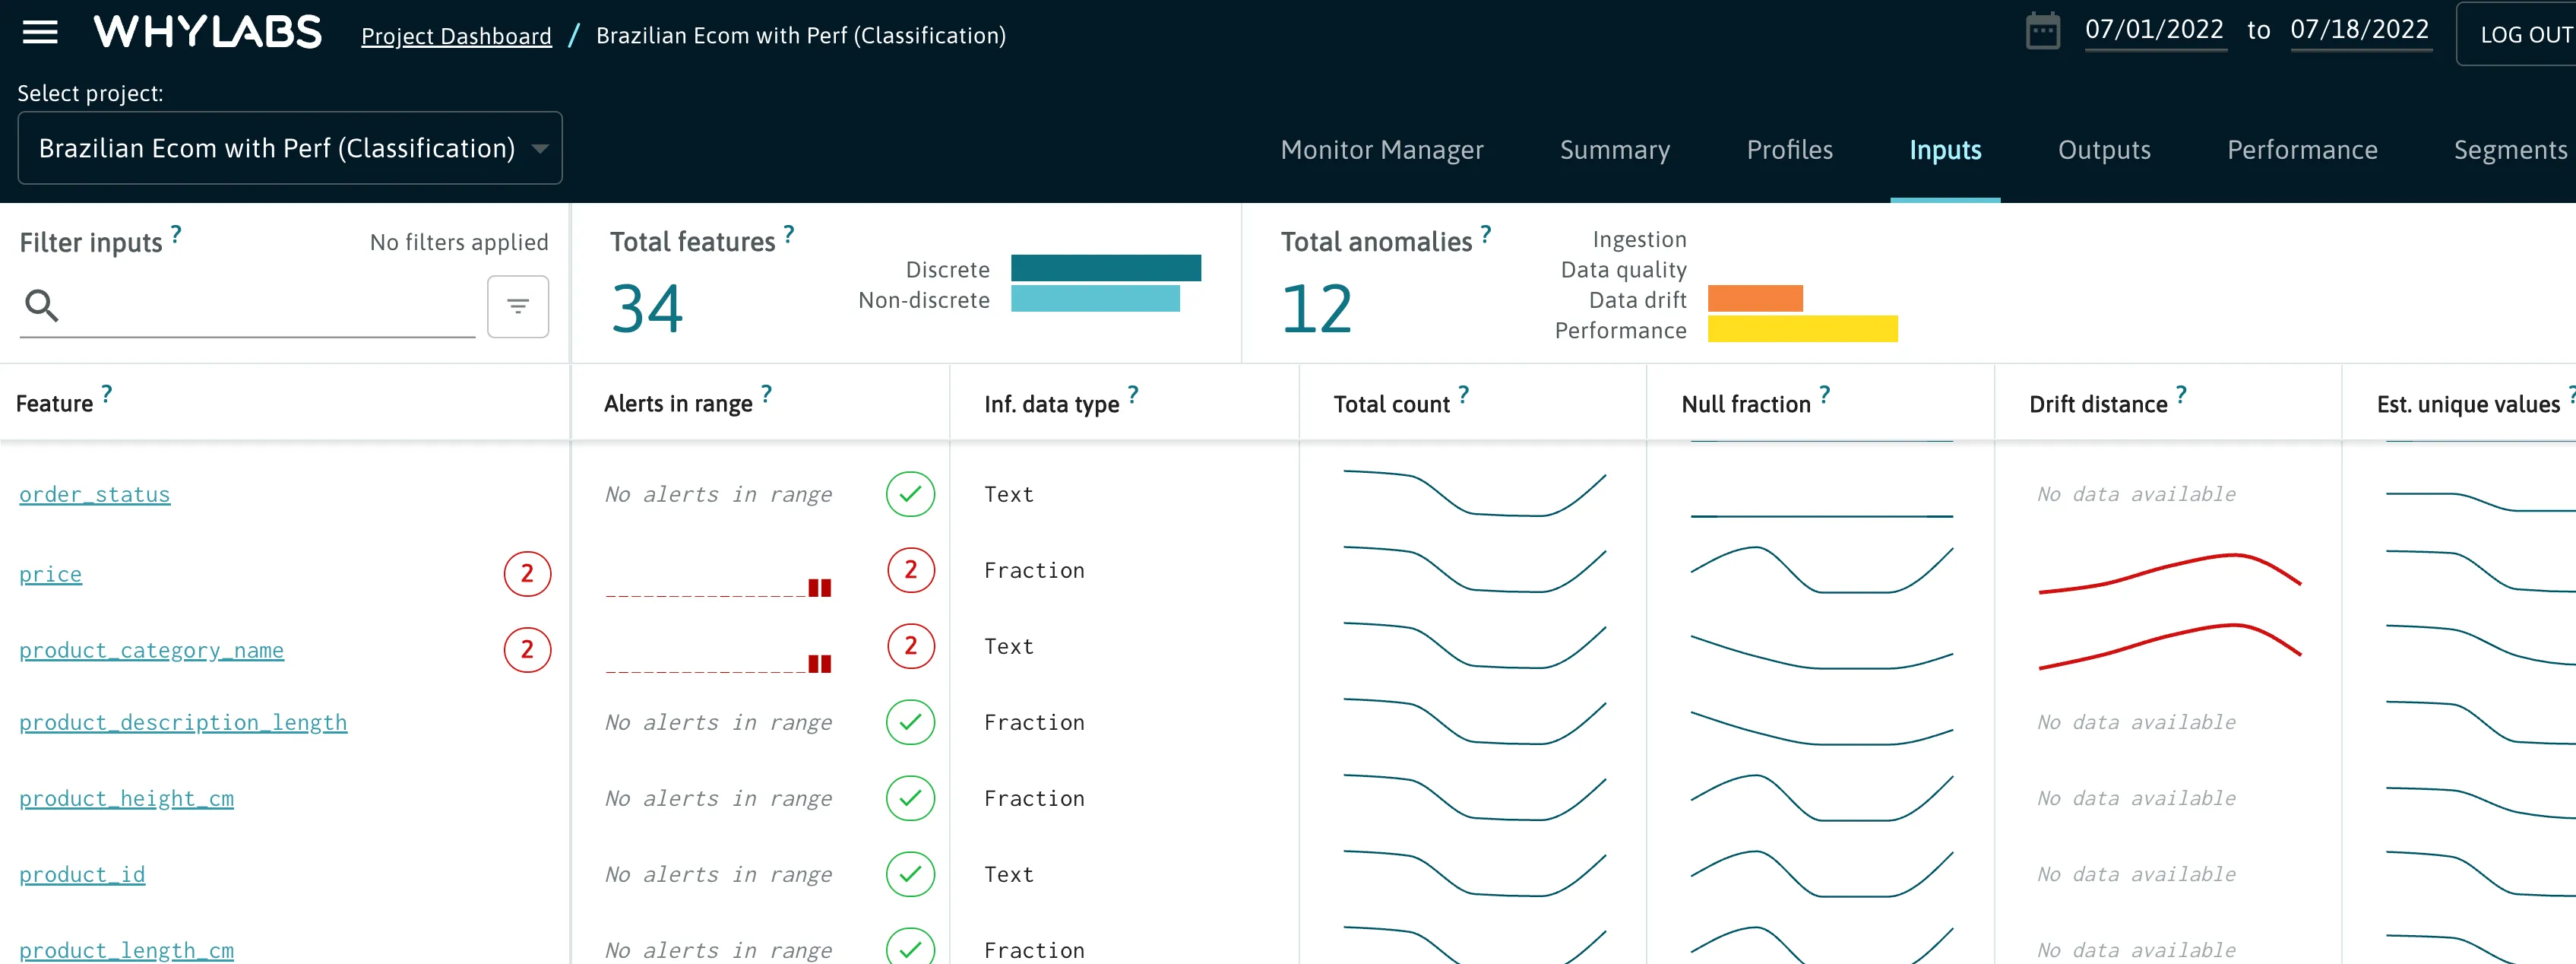
Users can also find anomalies in the feature level views (Inputs, Outputs, Performance). These will include a count along with a red highlighted trendline for the relevant metric being monitored.
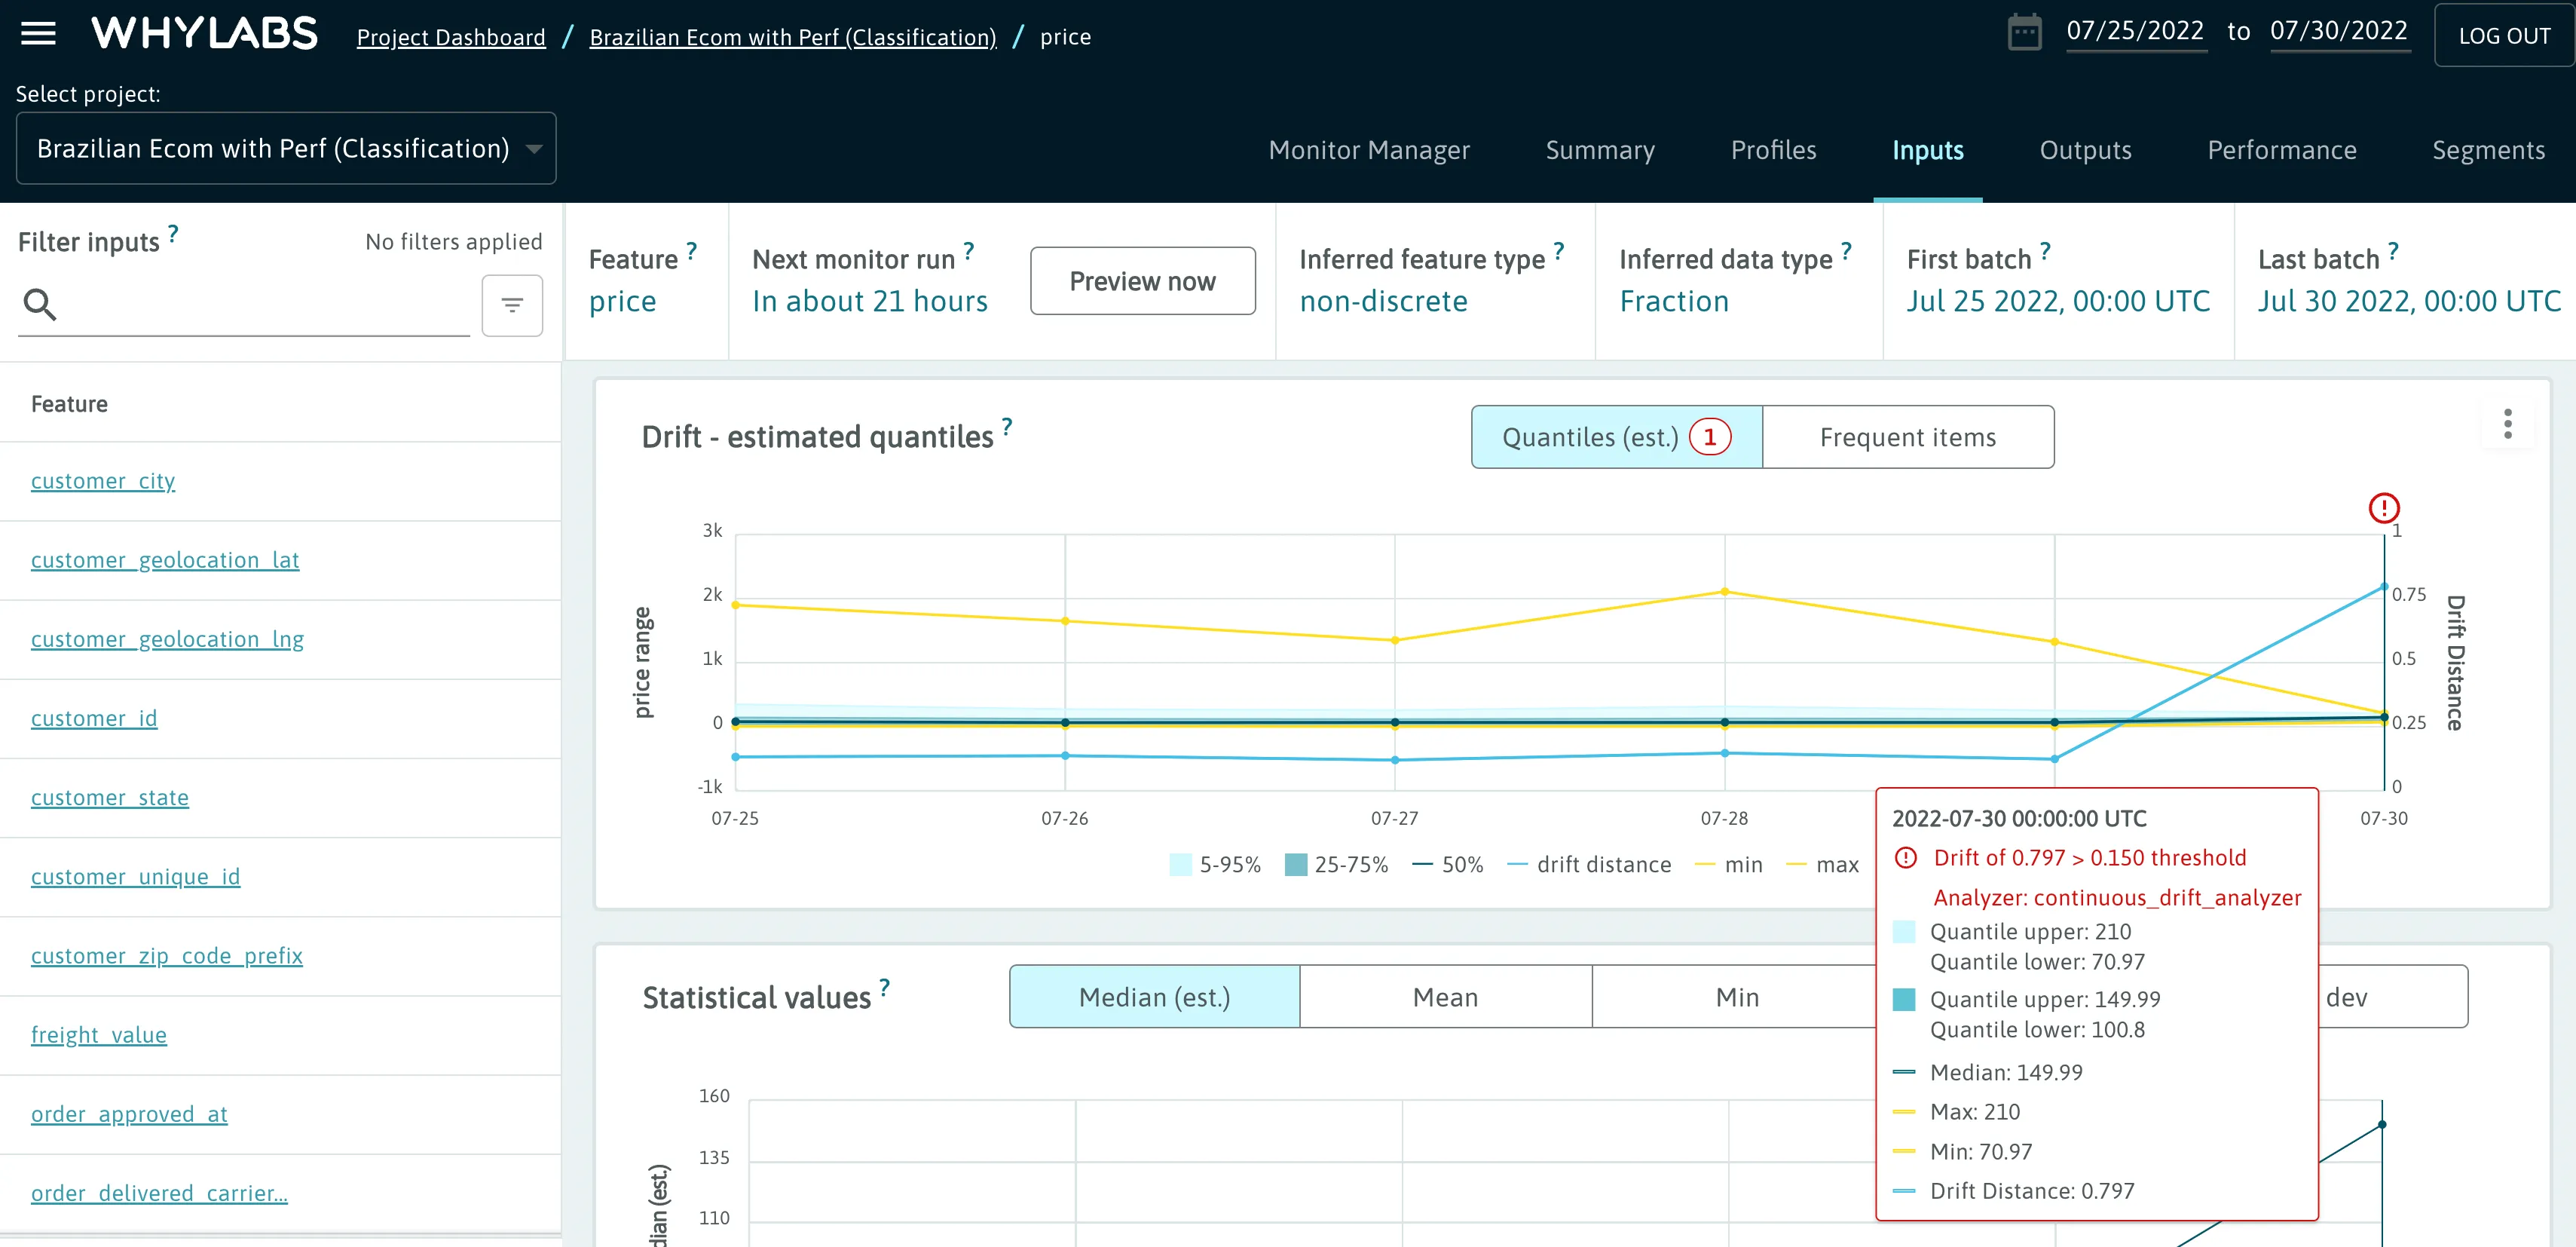
When clicking on a feature, these anomalies will also appear in the relevant time-series chart where users can get more context around the anomaly. Hovering over the red exclamation mark will display further details.