Ad-hoc Monitoring for Previewing Analysis Results
Overview
As users upload profiles to WhyLabs models over time, monitors are run against them on a regular cadence. When these monitors run, anomalies may be detected and notifications are sent out to users. In some cases, users may want to preview these anomalies for recently created or recently updated monitors before the next monitor run occurs.
Ad-hoc monitoring provides a preview of analysis results in real-time. This feedback loop lets users identify potential data quality and model health issues without needing to wait for the next scheduled monitor run. Furthermore, the analysis preview is useful when tuning monitors to help reduce noise from threshold and metrics that aren't calibrated correctly. In some cases, it may be helpful to backfil the analysis results for a specific monitor after previewing it.
The option to trigger a backfill is provided after an ad-hoc monitor run has completed.
The ad-hoc monitoring feature can be accessed with the “Preview analysis” button when viewing a particular feature, column, or metric for a monitored resource.
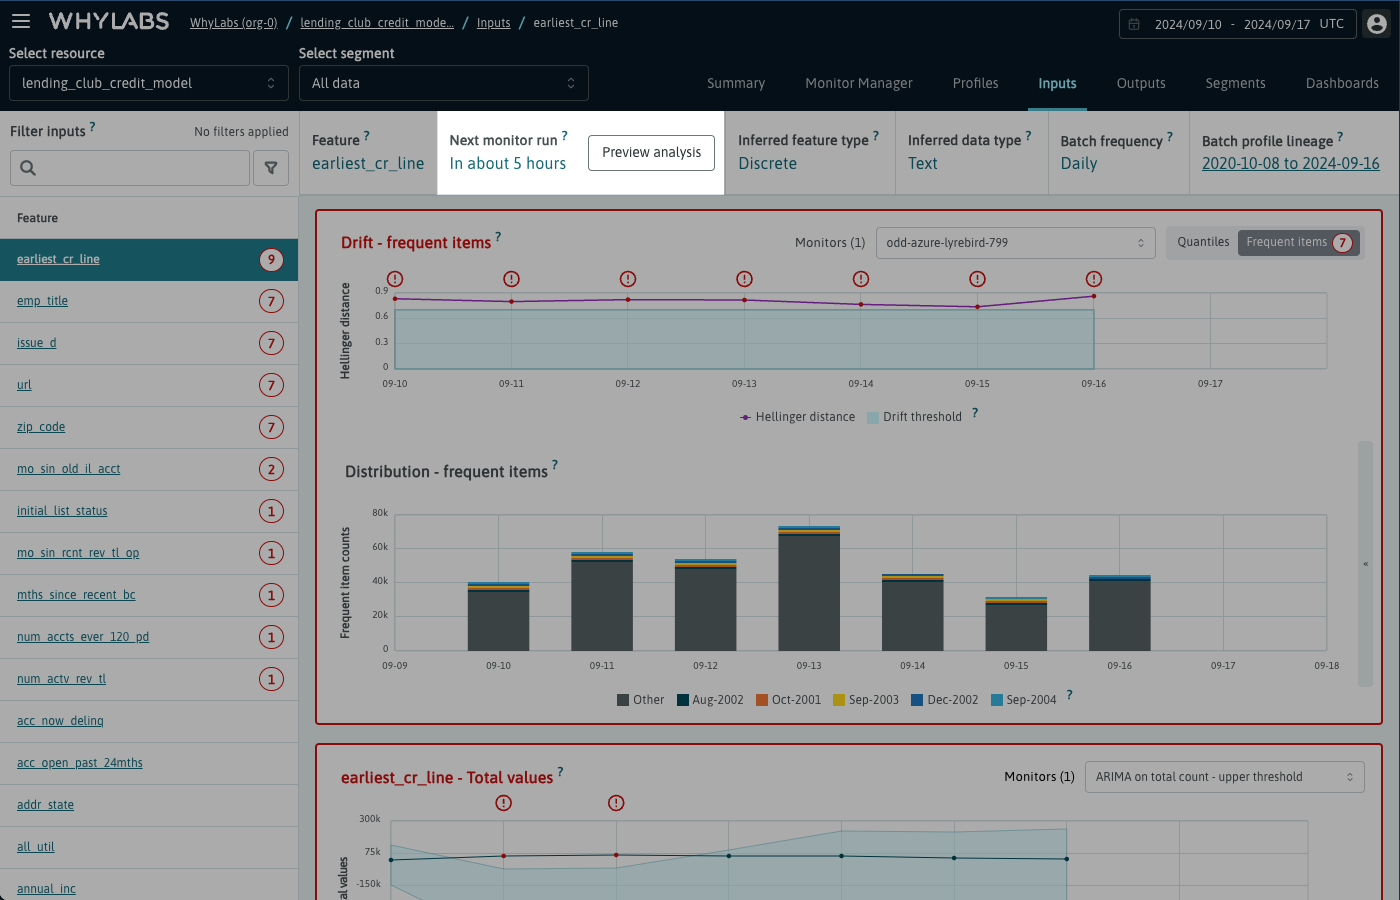 Location of the preview analysis button
Use case example
To demonstrate how users can preview and backfill a new monitor, we will create a new drift monitor called "My new drift monitor" using the monitor manager user interface.
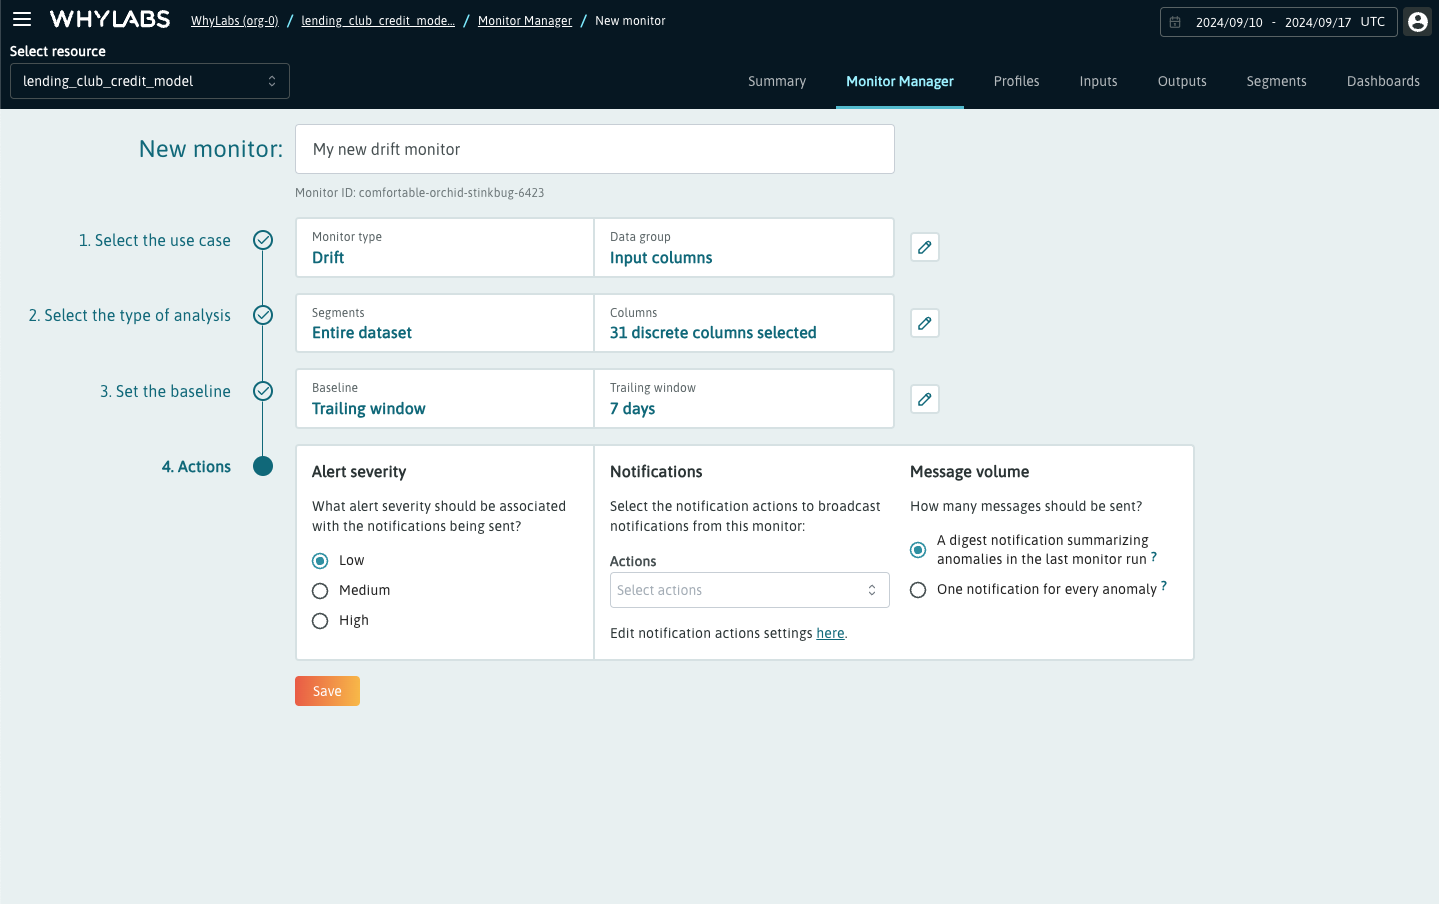 Using UI Builder to create a new drift monitor for discrete features
Once the monitor is created, we can go to a feature page. As the next scheduled monitor run is in 5 hours, the new monitor isn't included in list of active monitors on the drift chart.
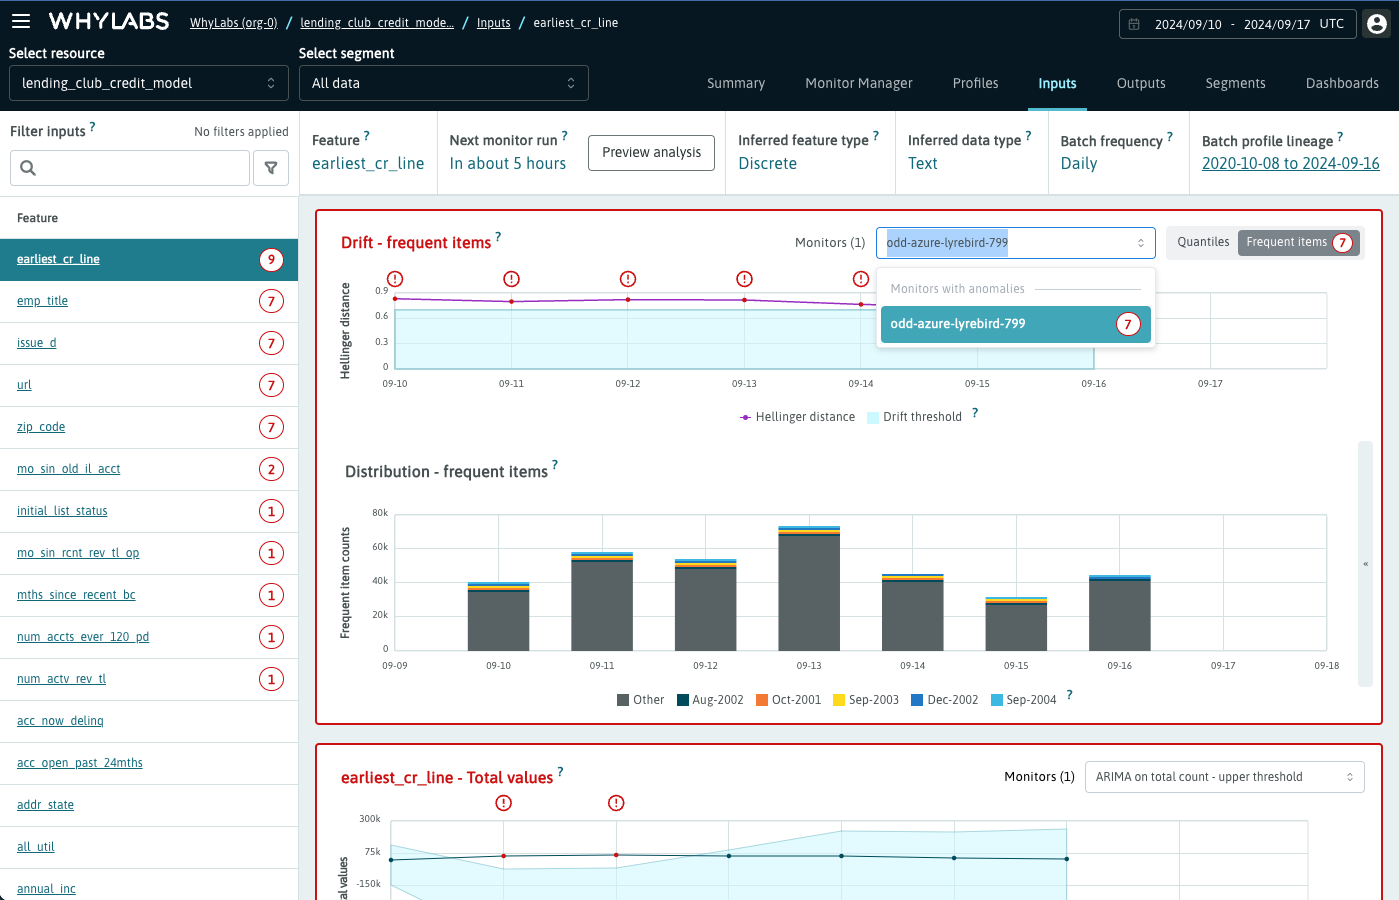 Image showing the list of drift monitors with analysis results, which doesn't include the newly created "My new drift monitor"
However, after creating a new monitor it's possible to preview its analysis results immediately. Simply click on the "Preview analysis" button, and select the new monitor from the list of available monitors in the preview analysis overlay. After the desired monitor has been selected, an analysis preview can be initiated by clicking on the "Preview now" button.
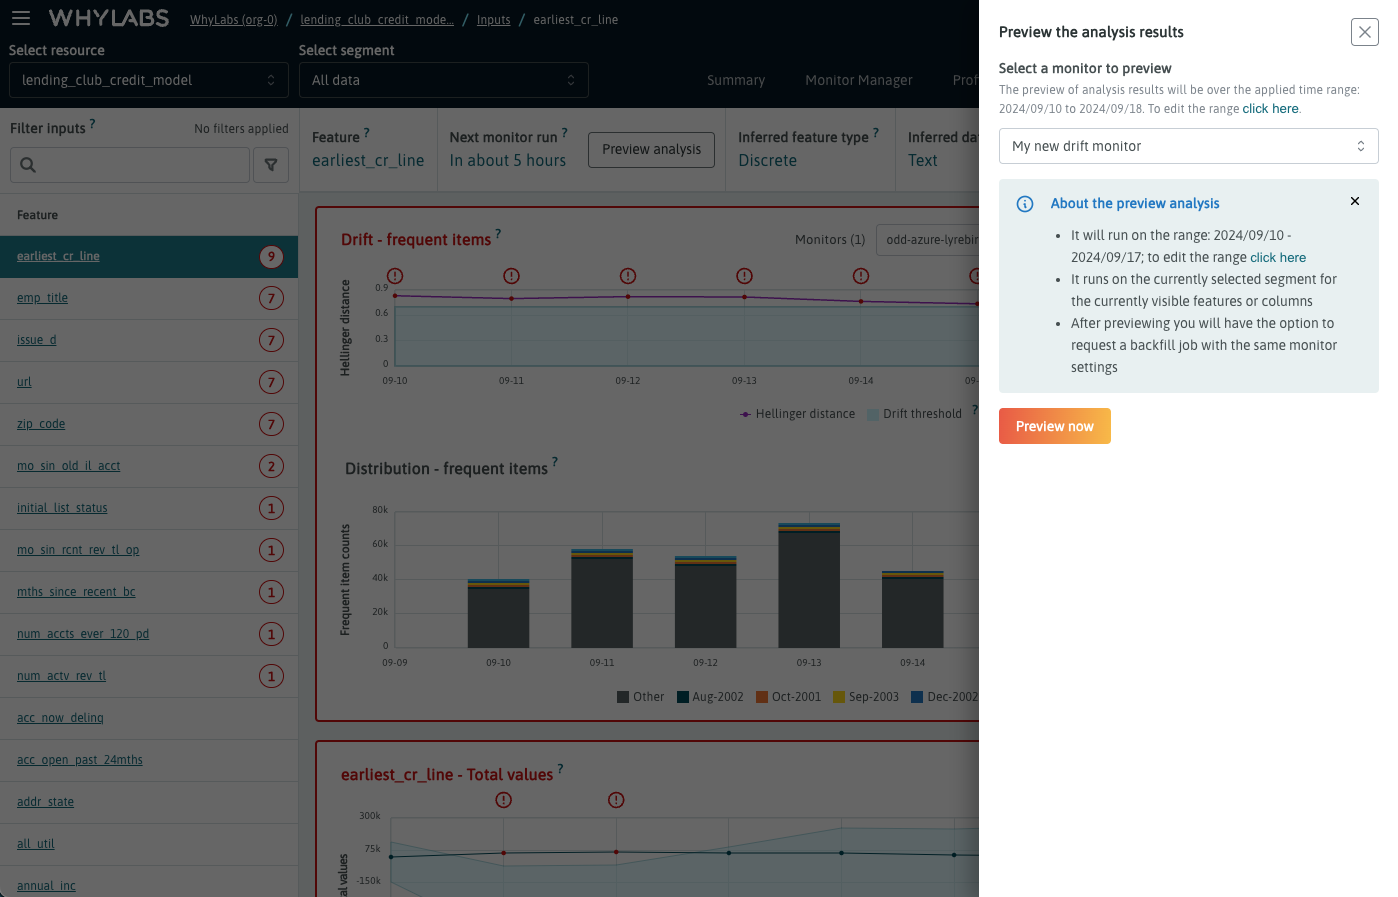 The preview analysis overlay
Previewing analysis may take time depending on the model size and resources availability. An analysis preview will be executed on each of the features displayed on the left list. Users can filter features as desired to run the analysis preview on a more targeted set of features.
In the image below, we see anomalies in orange which are generated by the monitor preview run for the 9 features listed. Users can explore these anomalies across these 9 features as desired. The preview can be closed by clicking “Close” in the top banner.
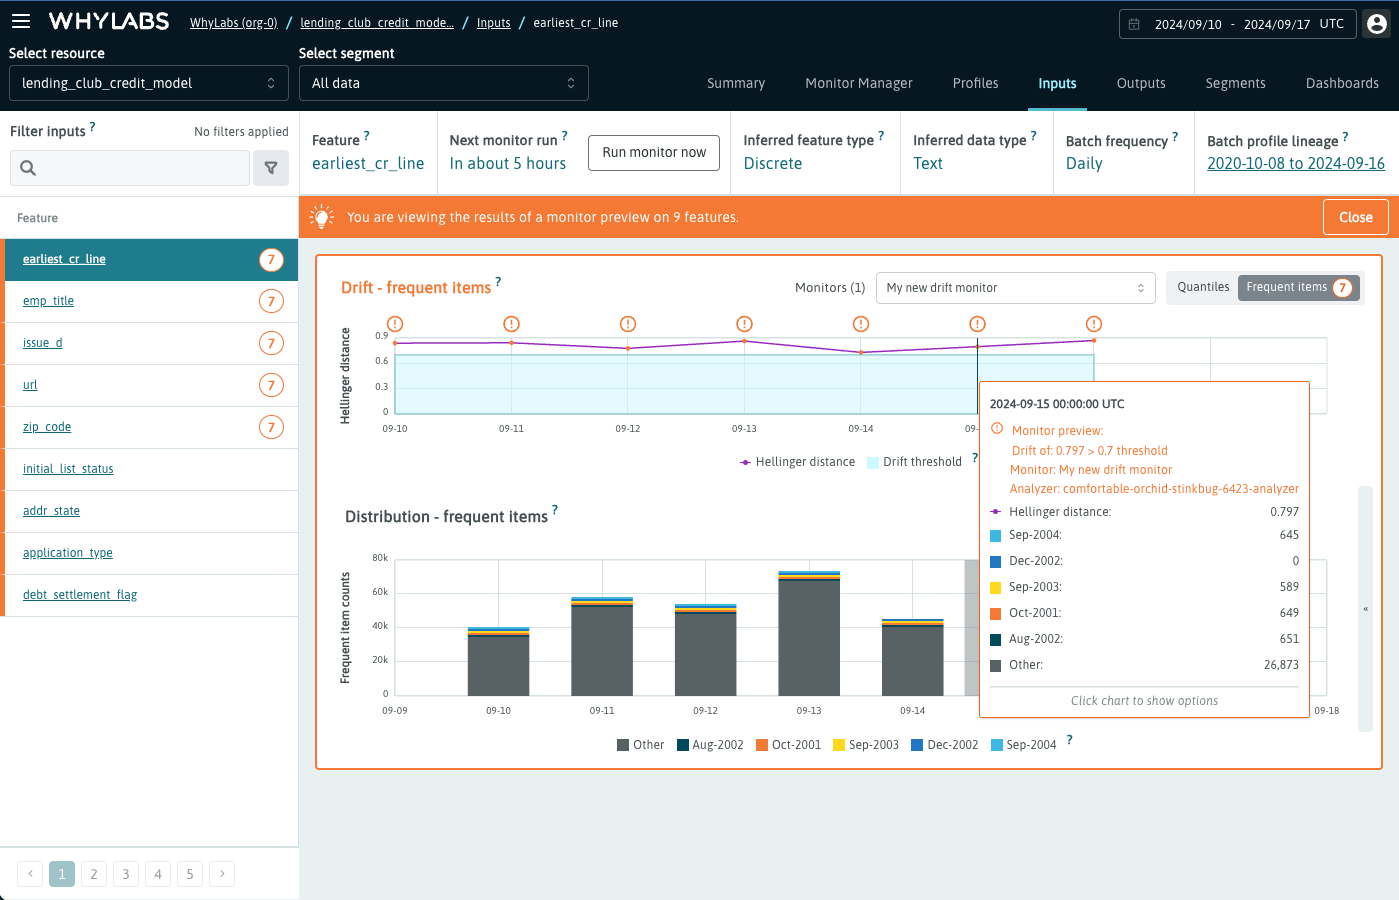 The previewed analysis displayed on the drift chart
Once the preview analysis has been reviewed and deemed satisfactory, users may request a backfill to persist that analysis for a specified time range in the past.
After clicking the "Run monitor now" button in the header component, the overlay is updated to provide the option to initiate an analysis backfill for the previewed monitor. Select the time range for the backfill, then review and acknowledge the backfill details prior to starting the backfill.
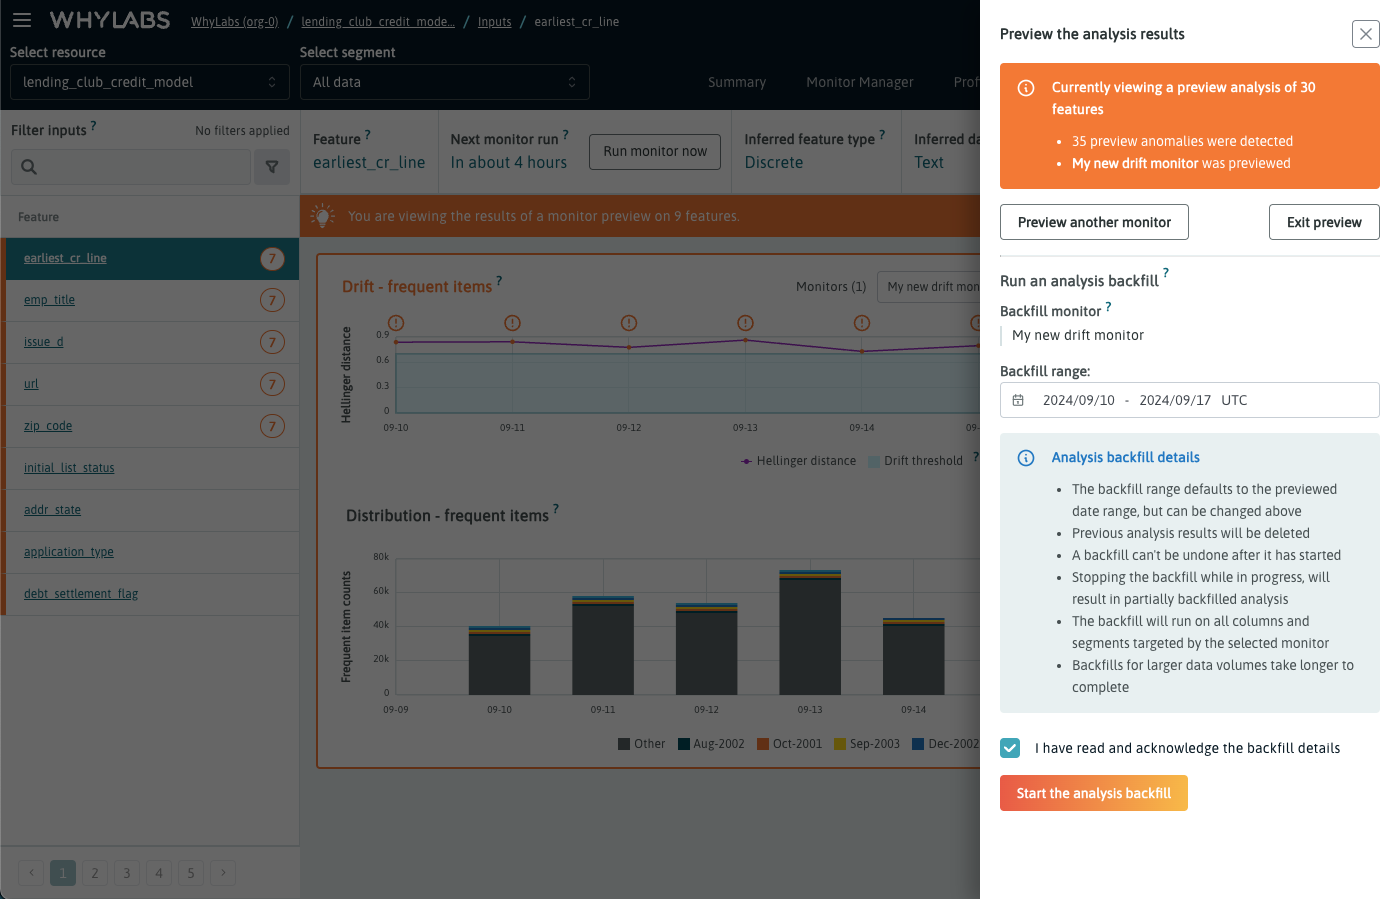 The overlay after the monitor preview run, allowing users to start a backfill
Please be aware that the analysis backfill is an asynchronous process, meaning that it's possible to navigate away from the page while the backfill is processing. However, it's not possible to request another backfill while one is already in progress.
Reloading the page after the backfill is complete will enable the analysis results for “My new drift monitor” to be displayed. To view results for a specific monitor, simply select it from the monitor dropdown and the visualization will update to show the selected monitor's analysis results including any anomalies that were detected.
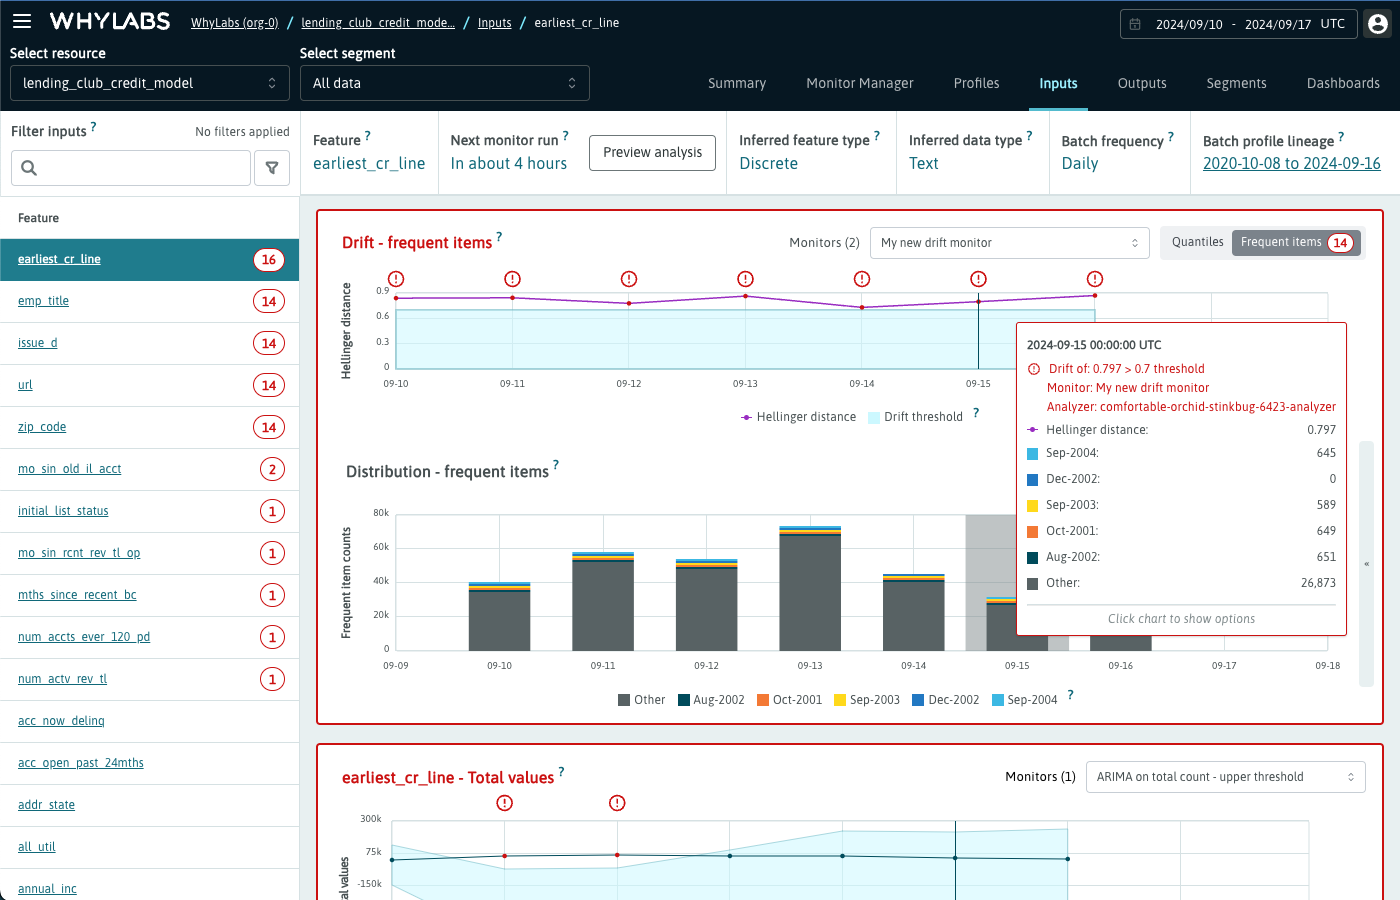
With Ad-hoc monitoring, users can be even more proactive when it comes to staying on top of data and resource health.
Limitations
The monitor preview is limited to the features visible in the list on the left with a maximum of 30 features.

