Supported Drift Algorithms
Algorithms for detecting and monitoring drift
Overview
This page provides background information on the different drift algorithms supported by the WhyLabs Platform that can be used to detect and monitor for drift. It highlights some of the considerations to keep in mind when selecting a drift measure, and when a specific algorithm might be appropriate.
Drift can be detected with a calculation to compare the probability distribution of two datasets which results in a drift measure. For production use cases, this typically involves comparing the inference data (inputs or outputs) over time, against a baseline or a reference set. The WhyLabs Platform supports various options for setting the baseline that can be found here.
For a comprehensive overview of data drift monitoring and its importance in MLOps, please refer to this blog post.
Supported algorithms
When it comes to drift detection there are many ways to compute a distance, and should be informed by the particular use case. The WhyLabs Platform supports four algorithms for detecting and monitoring drift:
- Hellinger (H) distance (WhyLabs Platform Recommended),
- Kullback-Leibler (KL) divergence,
- Jensen-Shannon (JS) divergence, and
- Population Stability Index (PSI)
Each has its advantages and disadvantages and some trial and error maybe required to tune the monitor to achieve a suitable signal-to noise-ratio.
Hellinger distance
The Hellinger distance is a calculation based on a comparison of the square root of the probability distributions, rather than calculating the raw probabilities. As an analog to Euclidean distance, it offers a number of benefits which is why it's recommended for use with the WhyLabs Platform:
- It's a more robust measure than KL divergence and Jensen-Shannon (JS) divergence, both of which can both be overly sensitive, which in turn can result in false-positives
- It generalizes to both discrete (categorical) and non-discrete (numerical) features
- It's symmetric which helps in capturing bidirectional changes in the data distribution, and satisfies all properties of a mathematical measure
- It's easily interpretable, and always falls within the range of 0 to 1, with 0 indicating no divergence and 1 indicating completely different distributions
That said, Hellinger Distance may not be sensitive enough to detect small changes in distribution due to its robustness. For cases where that's important using KL or JS divergence might be more suitable. In many cases though it's not important to detect minor drifts, so using Hellinger distance offers some advantages as noted above.
Kullback-Leibler (KL) divergence
The KL Divergence is another popular measure used to quantify the distance between two probability distributions.
Unlike Hellinger Distance, KL Divergence offers greater sensitivity to detect small changes in distribution making it capable of detecting subtle drift patterns, and comes from a well-established theoretical background. Conversely, when using it for monitoring its sensitivity to outliers can have a considerable impact on the divergence measure leading to false-positive drift anomalies. Additionally:
- It's asymmetric, and fails to satisfy properties of mathematical measure which can make it challenging to pinpoint the exact changes in the data that caused the drift.
- Minimizing KL divergence between the reference distribution and the target distribution is same as maximum likelihood estimation, and corresponds to minimizing the cross entropy between distributions
Jensen-Shannon (JS) divergence
The Jensen-Shannon divergence is a symmetrical version of KL divergence and is often considered a more robust alternative. It addresses the sensitivity to outliers by taking the average of the KL divergence between two distributions in both directions. As a result, JS divergence tends to be more stable and less prone to false positives compared to KL divergence.
- It provides a weighted mean of forward and backward KL divergence
- It's symmetric, and satisfies all properties of a mathematical measure
- It's easily interpretable, and always falls within the range of 0 to 1, with 0 indicating no divergence and 1 indicating completely different distributions
Population Stability Index (PSI)
PSI compares the distribution of predicted probability in scoring data with predicted probability in training or baseline data. The method of calculation accounts for the number of bins as well as the sample size, and its effectiveness can be influenced by these variables. The WhyLabs Platform creates histograms with 30 equal width bins and custom bin configuration isn't supported yet. Given this limitation, PSI might not provide the best option for drift detection where a custom binning strategy is required. A few characteristics of PSI:
- It's a simple formula using natural log of actual, expected frequencies
- It offers similar statistical properties as KL divergence; it's not symmetric and fails properties of mathematical measures
- It can be conservative when detecting subtle but meaningful drifts in the predicted probabilities
- It's interpretable, with values close to 0 indicating little to no drift, making it straightforward to understand the magnitude of drift
The following heuristics can be helpful for interpreting PSI:
PSI < 0.1: No change, you can continue to use the existing modelPSI >=0.1but less than0.2or0.25, a slight change is probably required.PSI >=0.2or0.25, a significant change is required. Ideally, you shouldn't use this model anymore - retraining required
Monitoring drift
Drift algorithm selection during monitor set up
It's relatively straightforward to select the drift algorithm in the monitor's configuration. It can be selected when configuring monitors via the UI builder, or by specifying the algorithm name when configuring the monitor using JSON.
Using the monitor UI builder
In the second step of the builder to "Select the type of analysis", you can select the drift algorithm that best suits your use case, and set the desired drift threshold that will be used to detect anomalies.
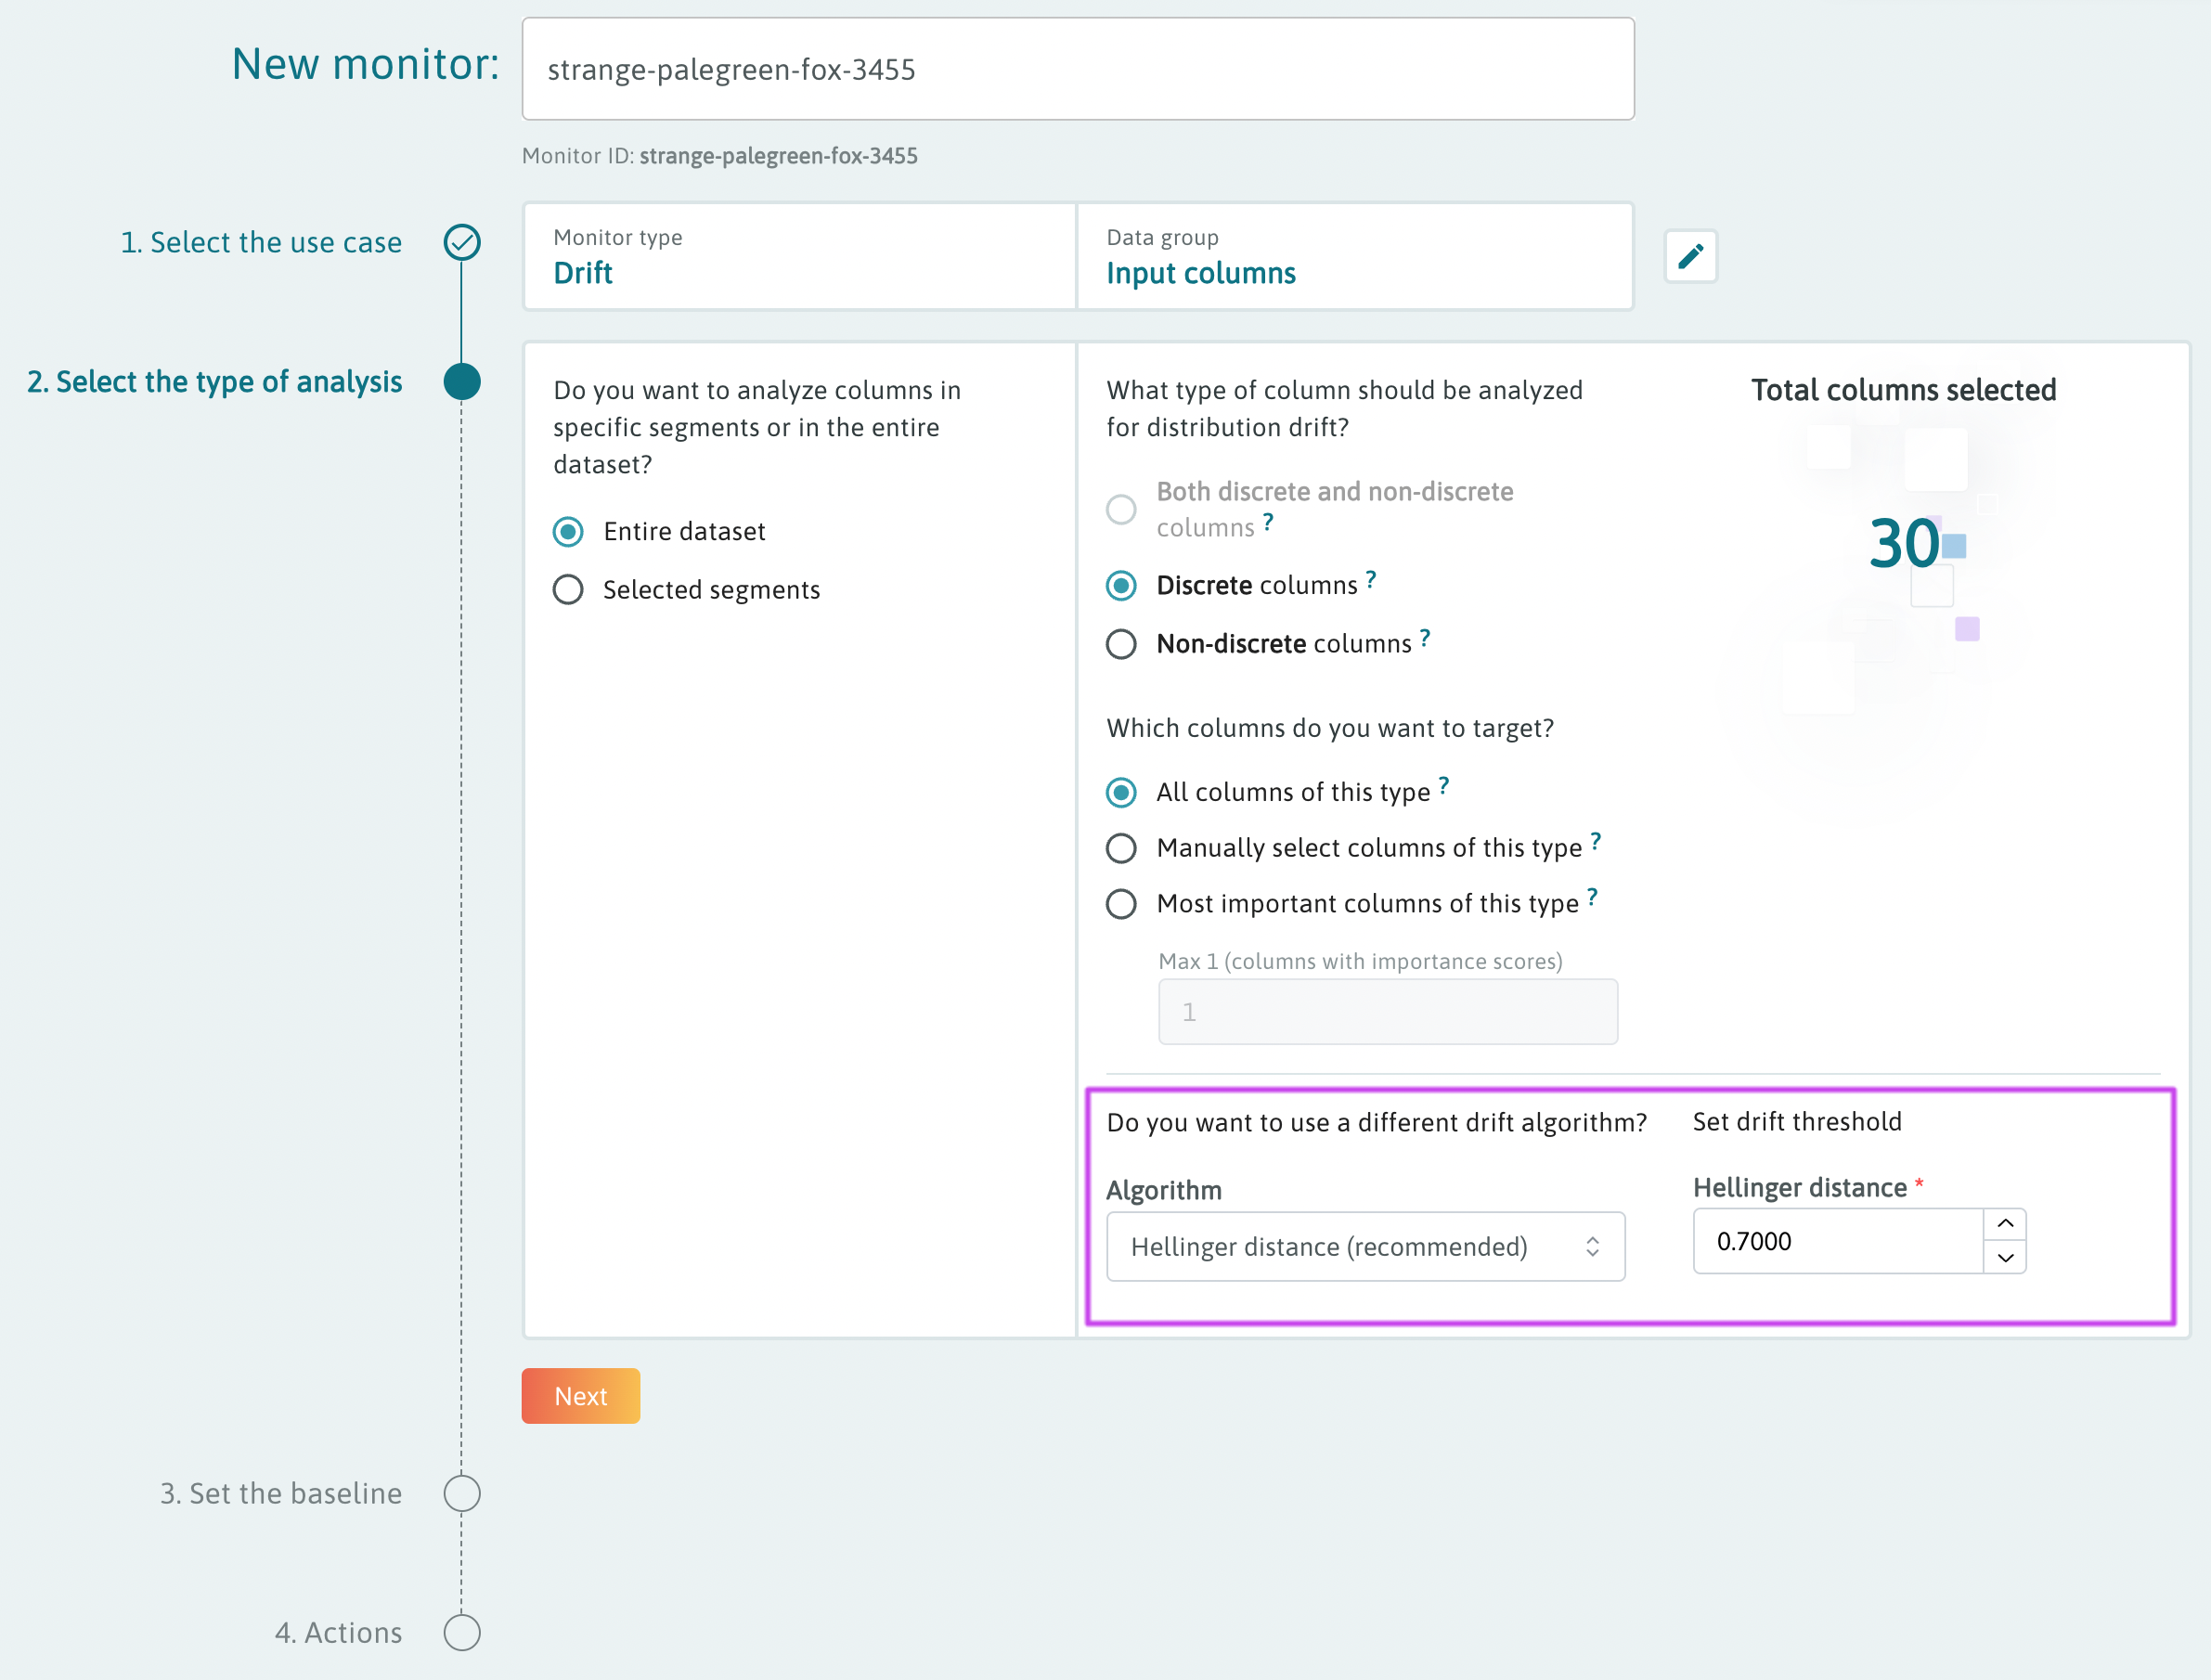
Note: drift monitor presets are configured to use Hellinger distance, but you can change drift algorithm during monitor setup by selecting the "Configure" option on the preset card, or by editing the monitor if a preset is enabled with one click.
Viewing drift results and anomalies
After a scheduled monitor run, the output of the analysis is available on the "Anomalies Feed" tab in the Monitor Manager portion of the WhyLabs Platform. Additionally, anomalies can be viewed on the time series charts for each monitored feature, column, or metric.
For more information on how to view and investigate anomalies can be found on the Anomalies page
Sources
- https://notesonai.com/KL+Divergence
- https://agustinus.kristia.de/techblog/2016/12/21/forward-reverse-kl/
- https://medium.com/model-monitoring-psi/population-stability-index-psi-ab133b0a5d42
- https://www.risk.net/journal-of-risk-model-validation/7725371/statistical-properties-of-the-population-stability-index
- https://parthaps77.medium.com/population-stability-index-psi-and-characteristic-stability-index-csi-in-machine-learning-6312bc52159d
- https://scholarworks.wmich.edu/cgi/viewcontent.cgi?article=4249&context=dissertations

