Monitor Manager Overview
It's painless to start monitoring whylogs profiles after they have been uploaded to the platform. WhyLabs monitors can be created with a single click, but users also have fine-grained control when customizing monitors for an ideal signal-to-noise ratio.
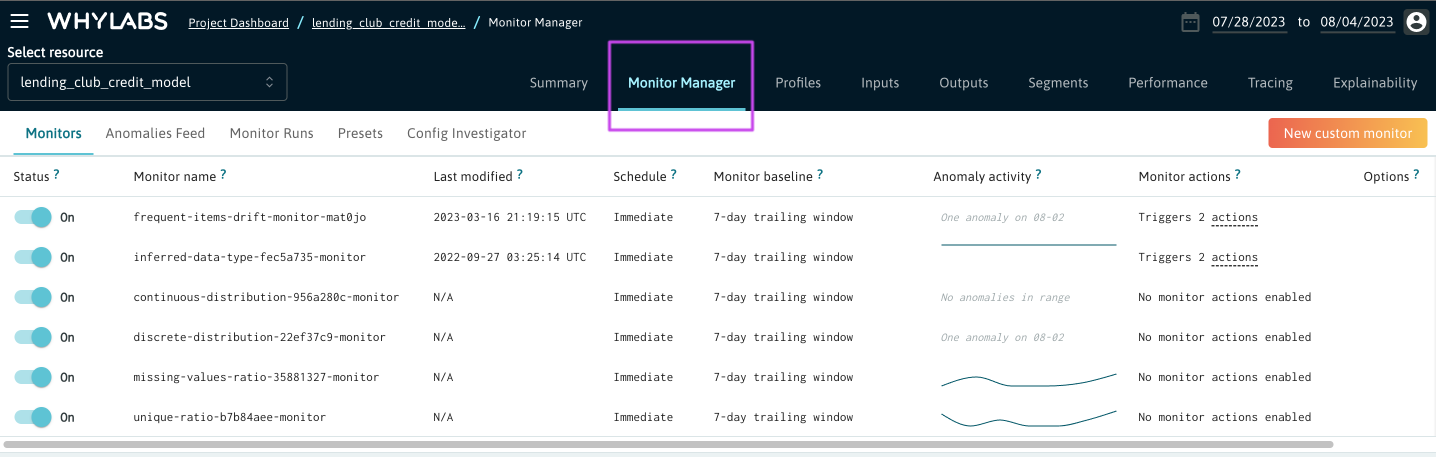
The Monitor Manager section of the WhyLabs Platform provides access to all monitor related configurations. Each resource (model or dataset) has a Monitor Manager tab.
Monitoring Capabilities
WhyLabs Observatory enables a comprehensive set of data and model health monitors for dataset features, model inputs, model outputs, and model performance. Users can create highly customizable monitors for things like…
- Data drift (distribution similarity, descriptive statistics)
- Data quality (missing values, schema, cardinality)
- Concept drift / label drift
- Model performance (various performance metrics for classification and regression)
- Top K values for categorical input features
- Data volume (inputs and outputs)
- Data ingestion (detects whether data has been delivered to a particular model)
Users have various options for defining baselines for comparison against including sliding windows, specific profiles, or fixed thresholds. WhyLabs users also have granular control over the specific features or segments which a monitor targets and can assign priority levels to notifications generated by these monitors.
Upon clicking on a project and navigating to the monitor manager, users have the option to create preset monitors from a single click or build custom monitors from scratch.
Note that legacy users may still be in the process of migrating to the new monitoring experience. If monitor manager is not available in your org, please refer to this page instead.
Preset Monitors
The “Presets” tab within monitor manager presents the user with a wide selection of preset monitors which can be enabled with a single click. For example, enabling the F1 Score Preset Monitor as shown below will create a monitor to detect when F1 Scores deviate by more than 10% from the rolling average across a 7 day trailing window.
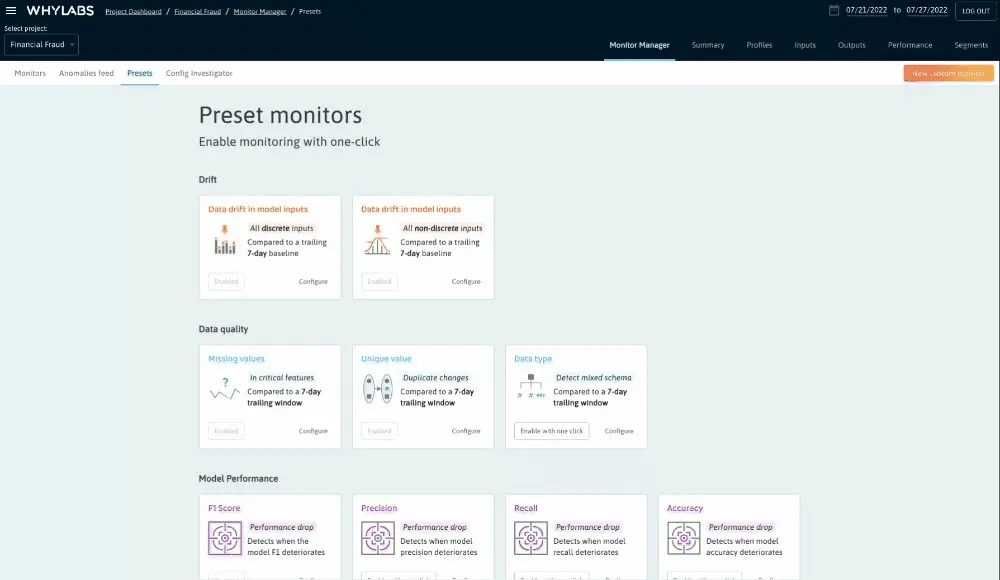
Users can also choose the “Configure” option to tweak the configuration of any given preset. Multiple Presets are available for Data Drift, Data Quality, Model Performance, and Integration Health.
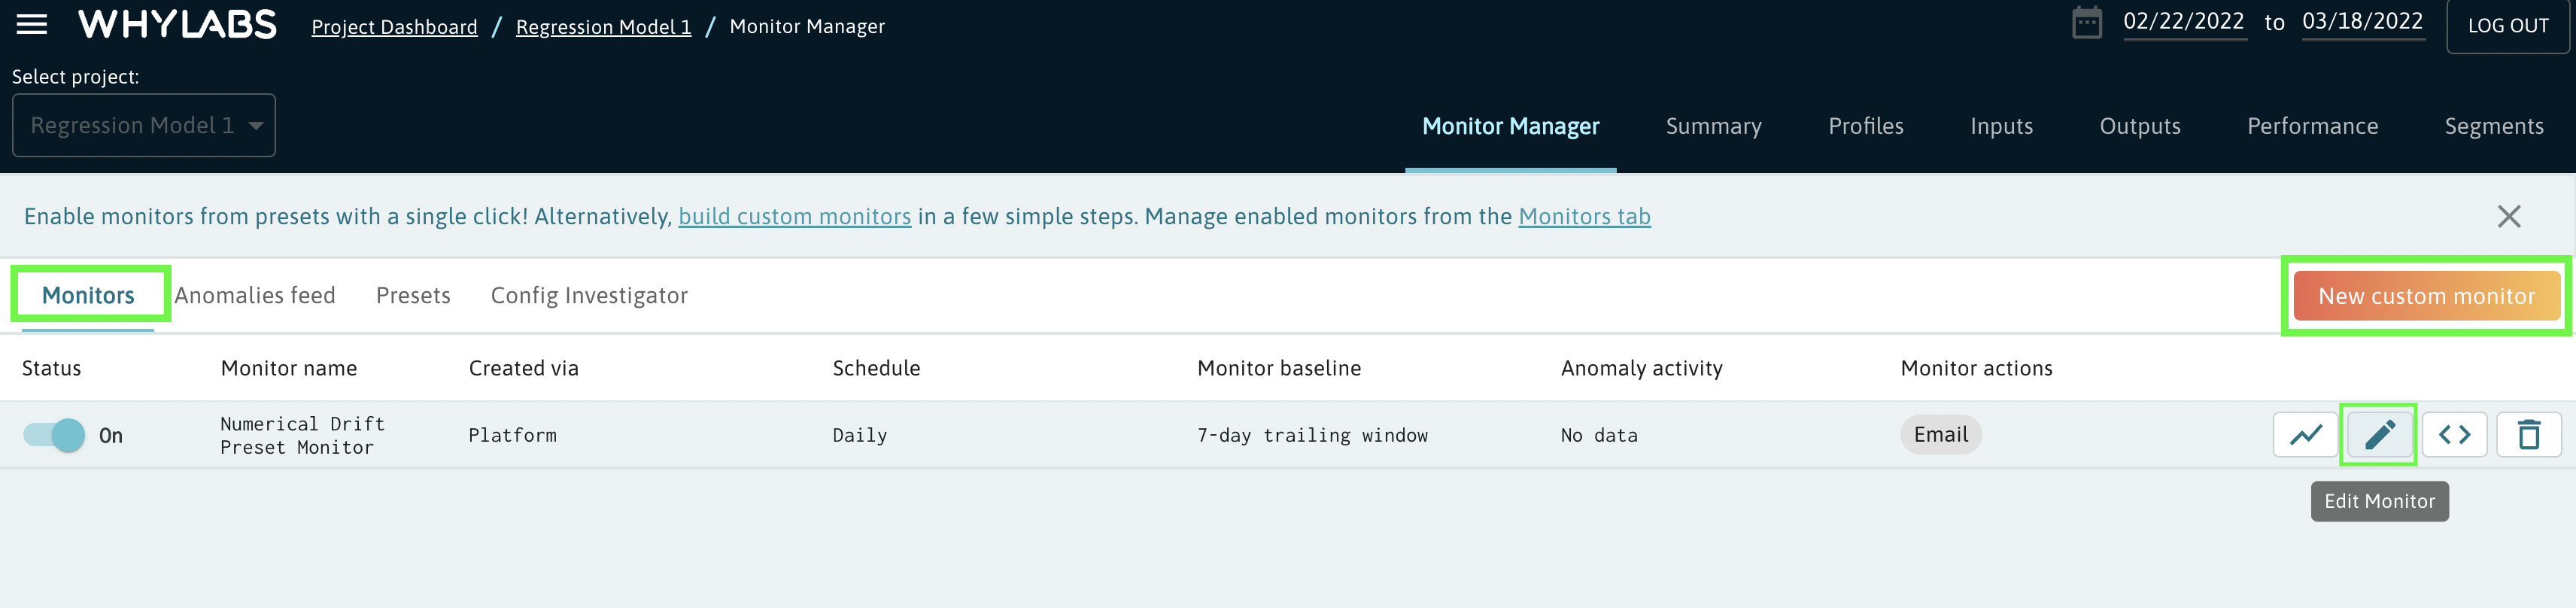
Upon enabling one of these monitors, users will see the new monitor added to the “monitors” section of the monitor manager. From this view, users can edit existing monitors or create a new custom monitor from scratch.
Creating Custom Monitors
Drift
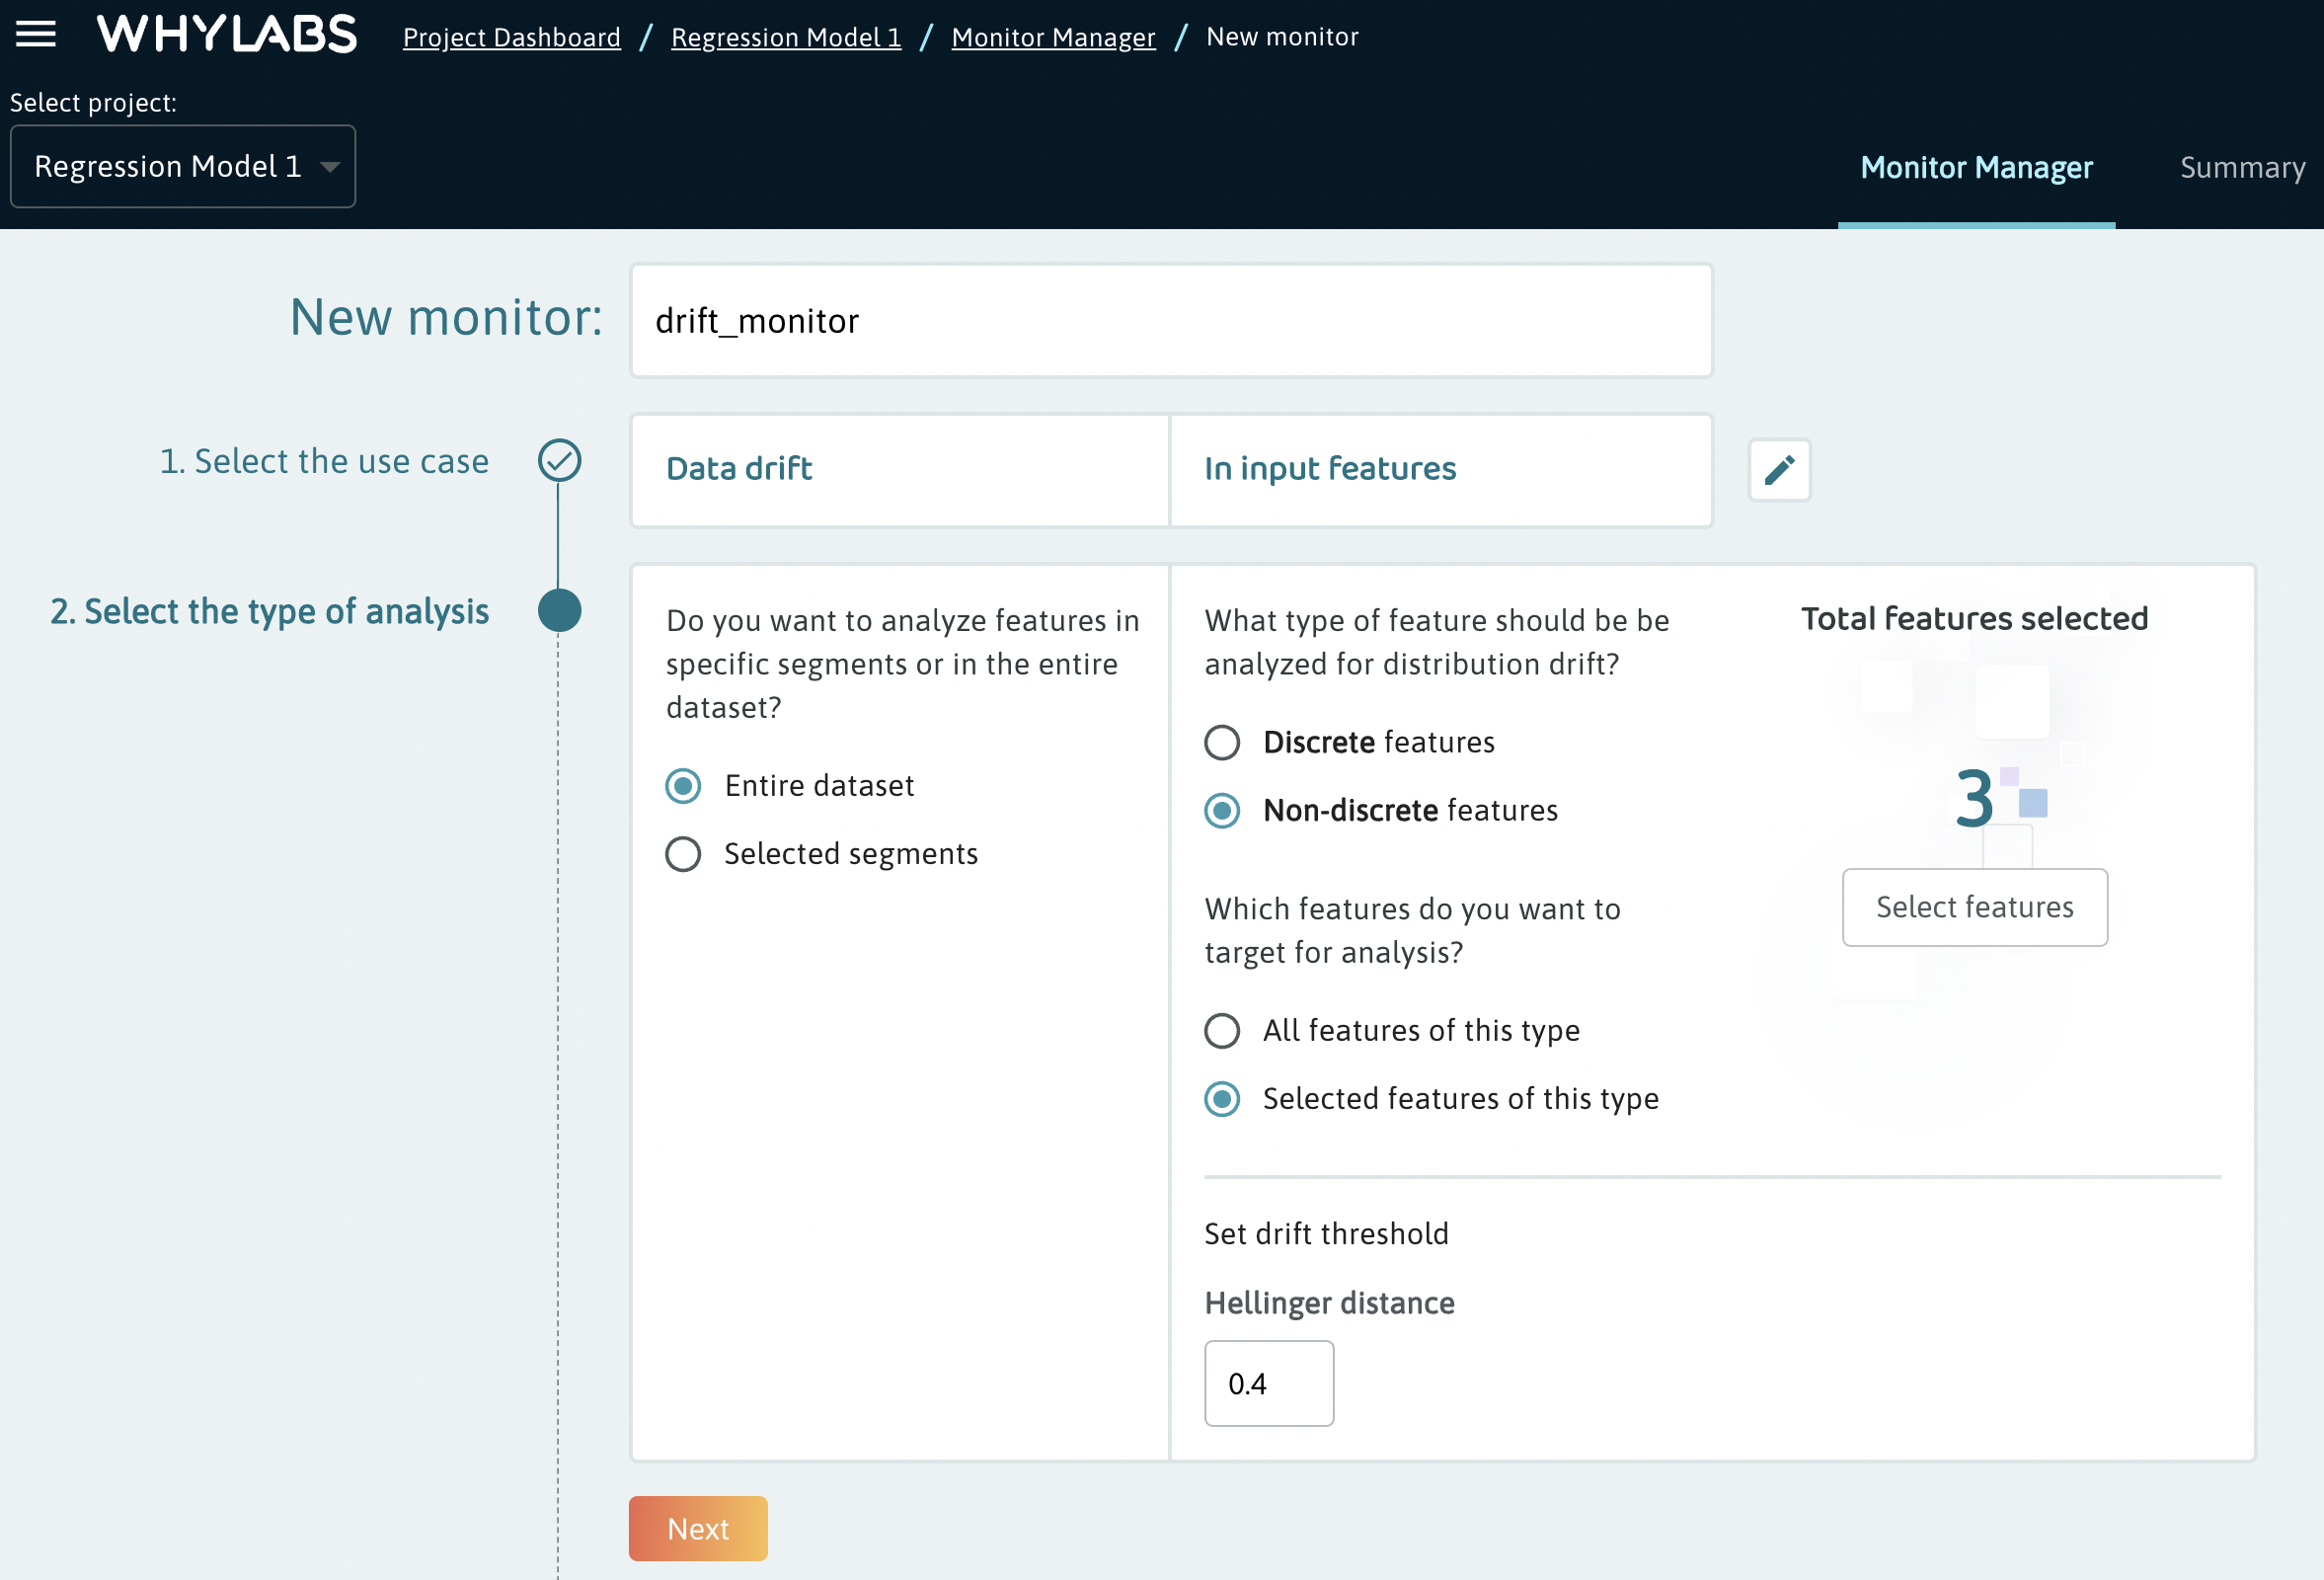
When creating a custom monitor, users must first select the type of monitor. In the example below, a drift monitor is selected and input features are targeted.

Type of Analysis
In the next section, users can select the data types targeted by this monitor as well as whether the monitor should target the entire dataset or specific segments. In this case, 3 specific non-discrete features are targeted at the entire dataset level.
In this case, the drift threshold is measured by the hellinger distance from the baseline and is set to 0.4. The hellinger distance is a measure ranging from 0 to 1 which quantifies how different a feature’s distribution is from the feature’s distribution in the baseline. The default value is 0.7, but an appropriate value for this metric will largely depend on the nature of the data being monitored and the desired tolerance for data drift.
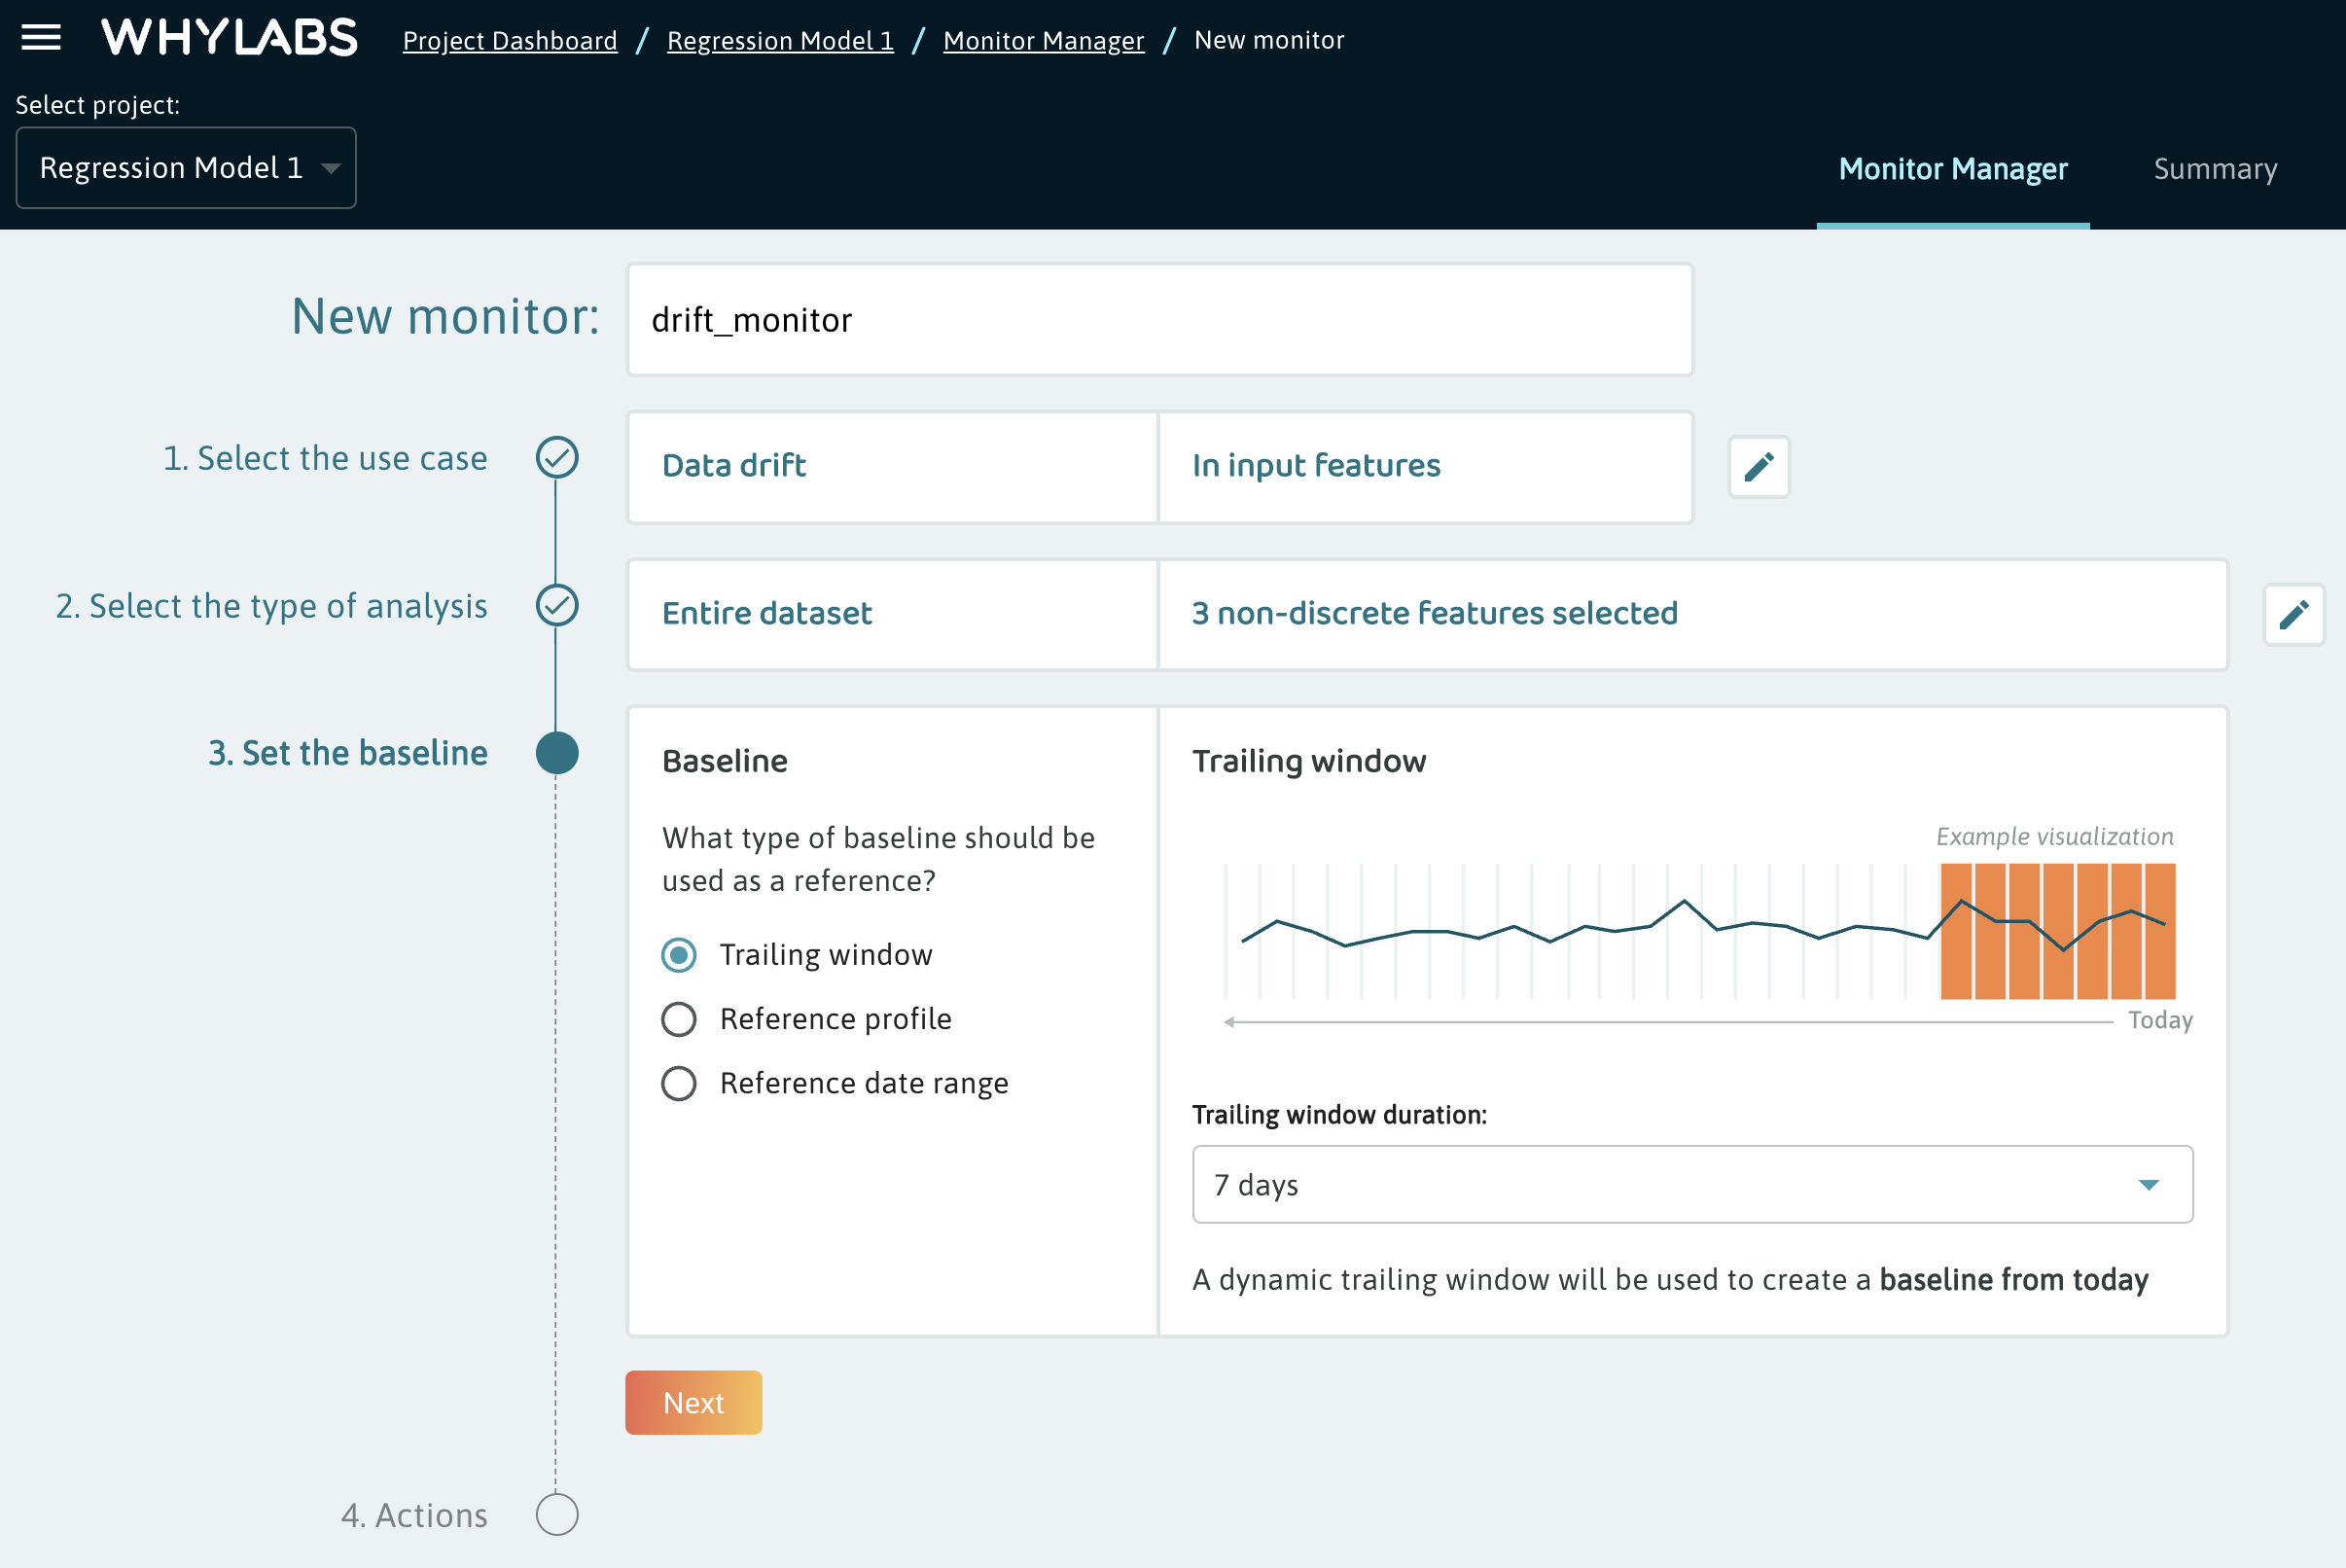
Baselines
Next, users can define the baseline to compare against. For drift, there are 3 options:
Trailing window- New profiles will be compared against an aggregated profile containing the number of days specified in the trailing window.
Reference profile- A user may wish to upload a profile for their training set, validation set, or just a sample of their dataset which is known to be healthy.
Reference date range- Users can also choose a certain date range of existing profiles which is known to be healthy. This can be a single day or multiple days.
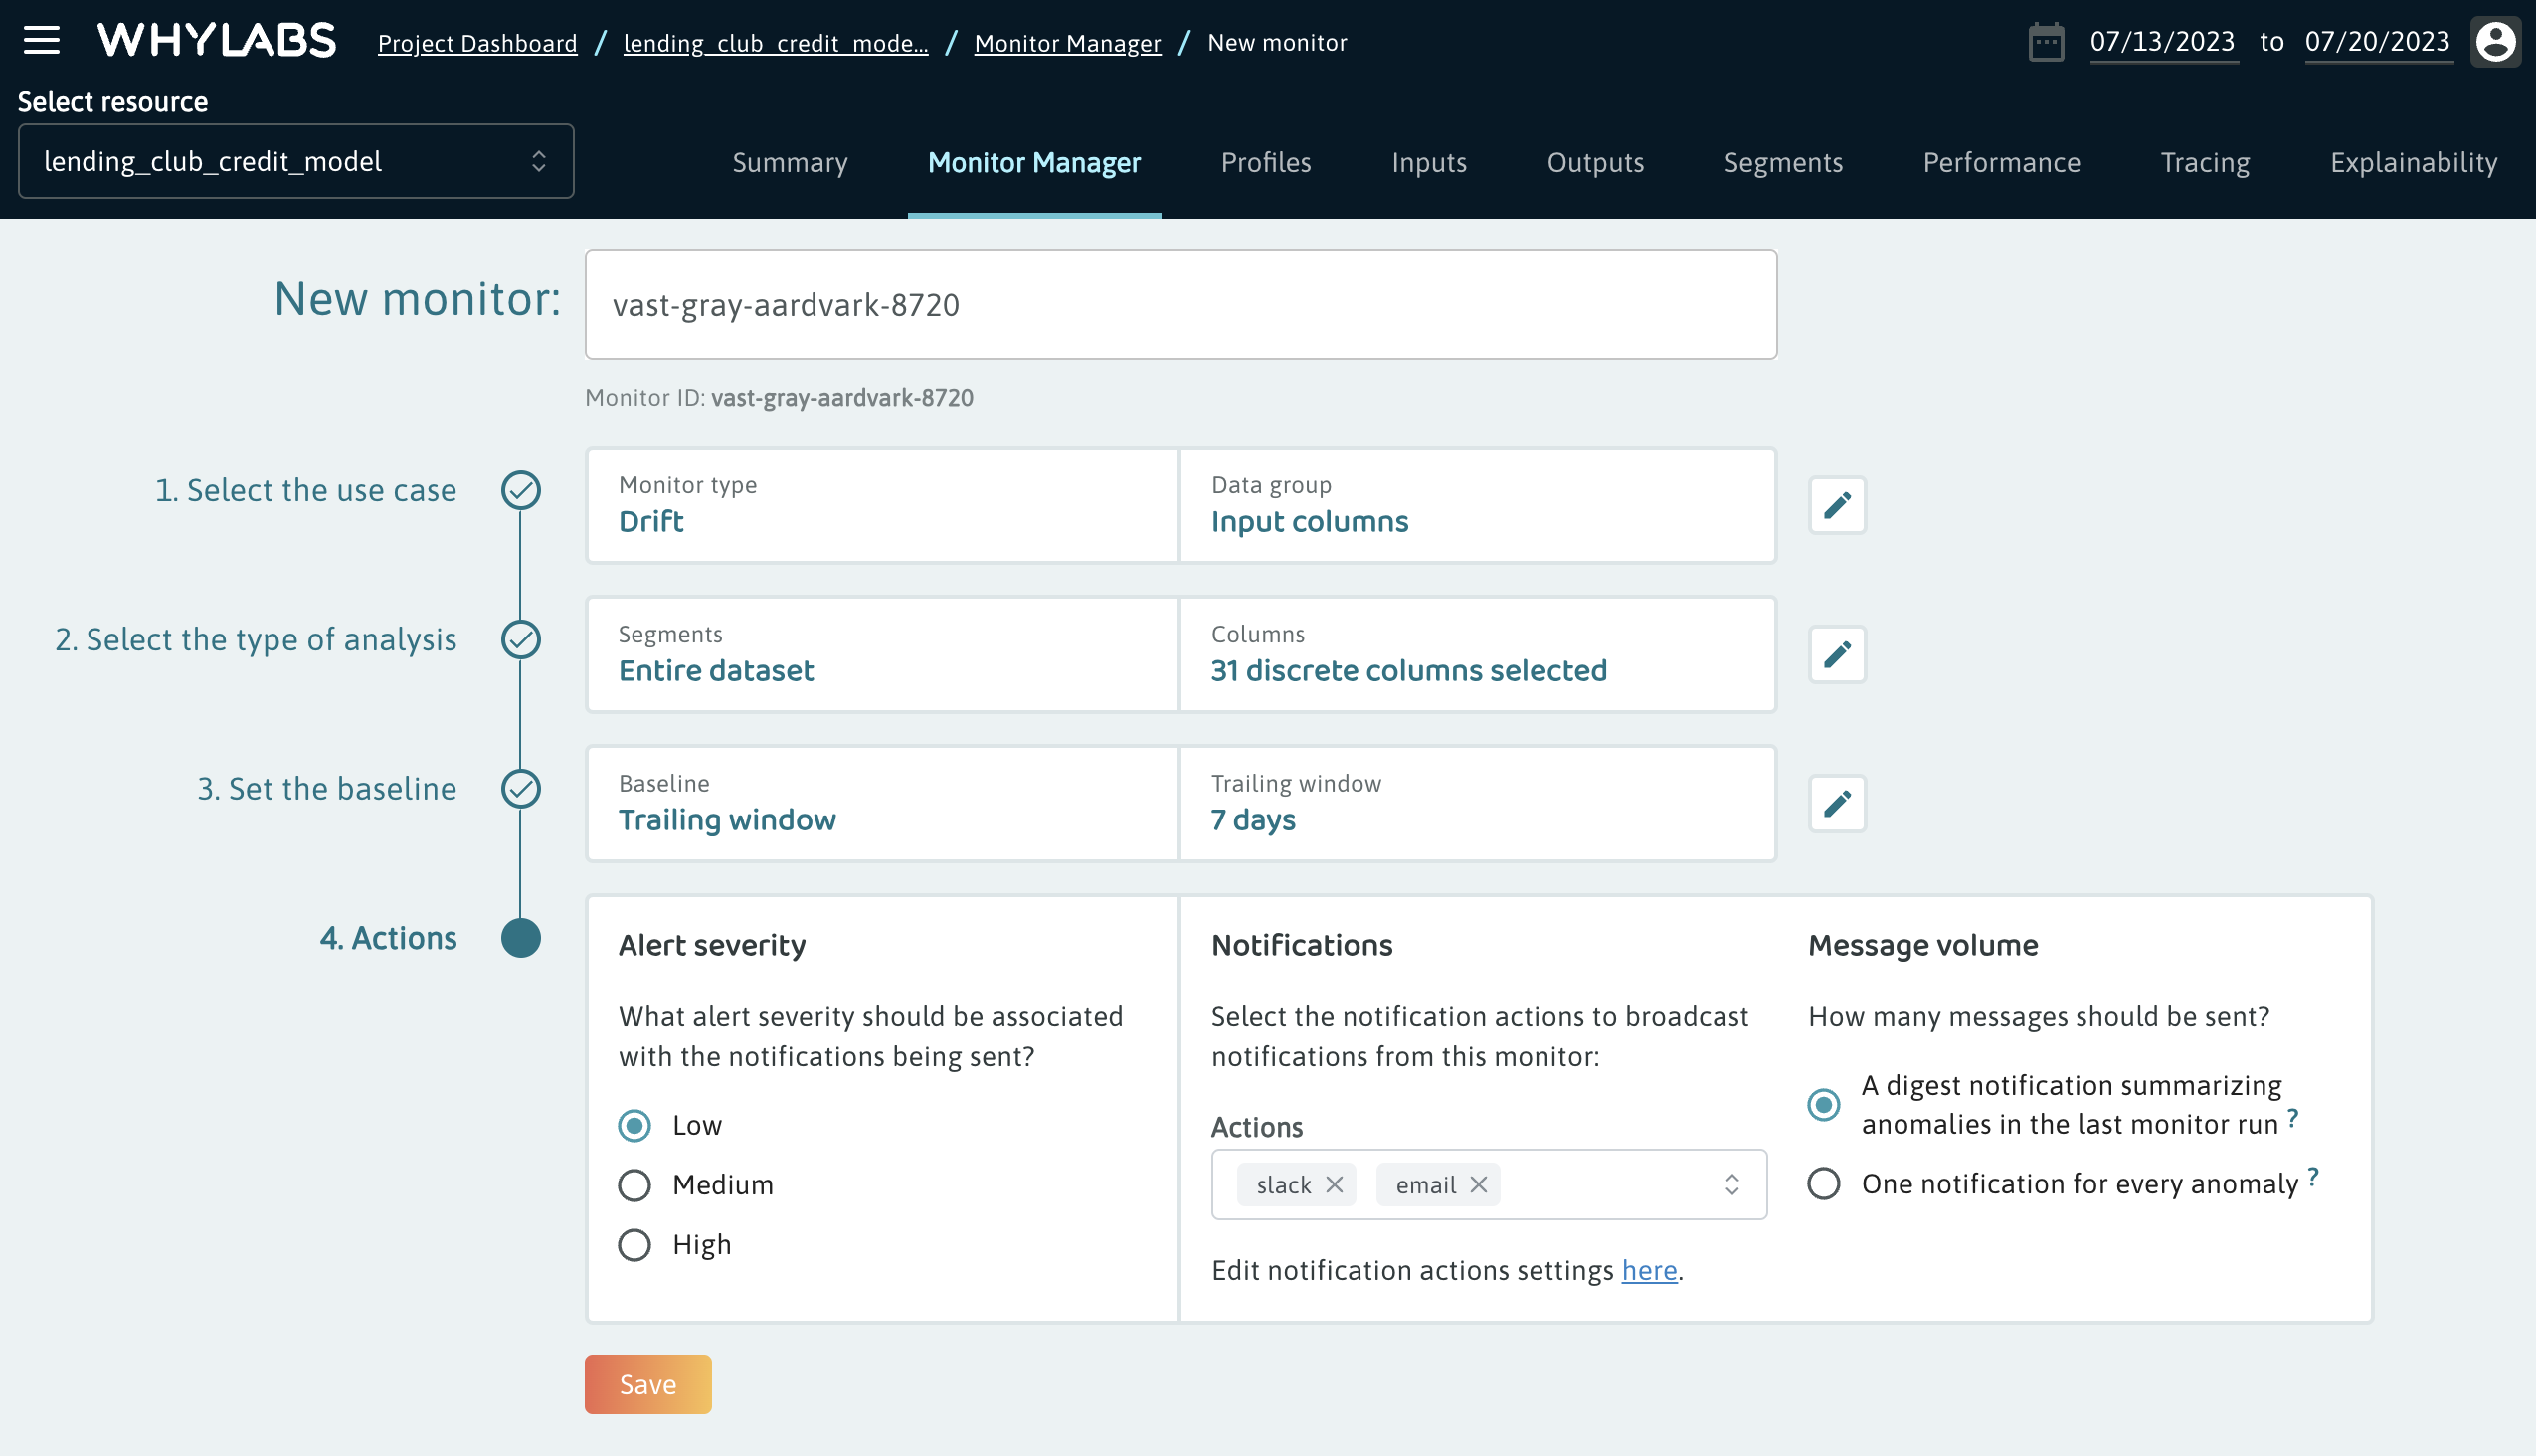
Actions
Lastly, users can set up actions. Actions define the events which are to take place when an anomaly is detected by the monitor. These include things like notifications, but will ultimately support things like custom webhooks or triggering automatic model retraining.
Users can assign an alert severity and include a custom message in the actions. This information will be included in any notifications sent by the action. In the notifications section, users can indicate which channels of communication these notifications should be sent to. The delivery details for these notifications channels can be configured within the settings section.
Data Quality
Data quality monitors include 3 categories:
- Missing value changes
- Unique value changes
- Inferred data type changes
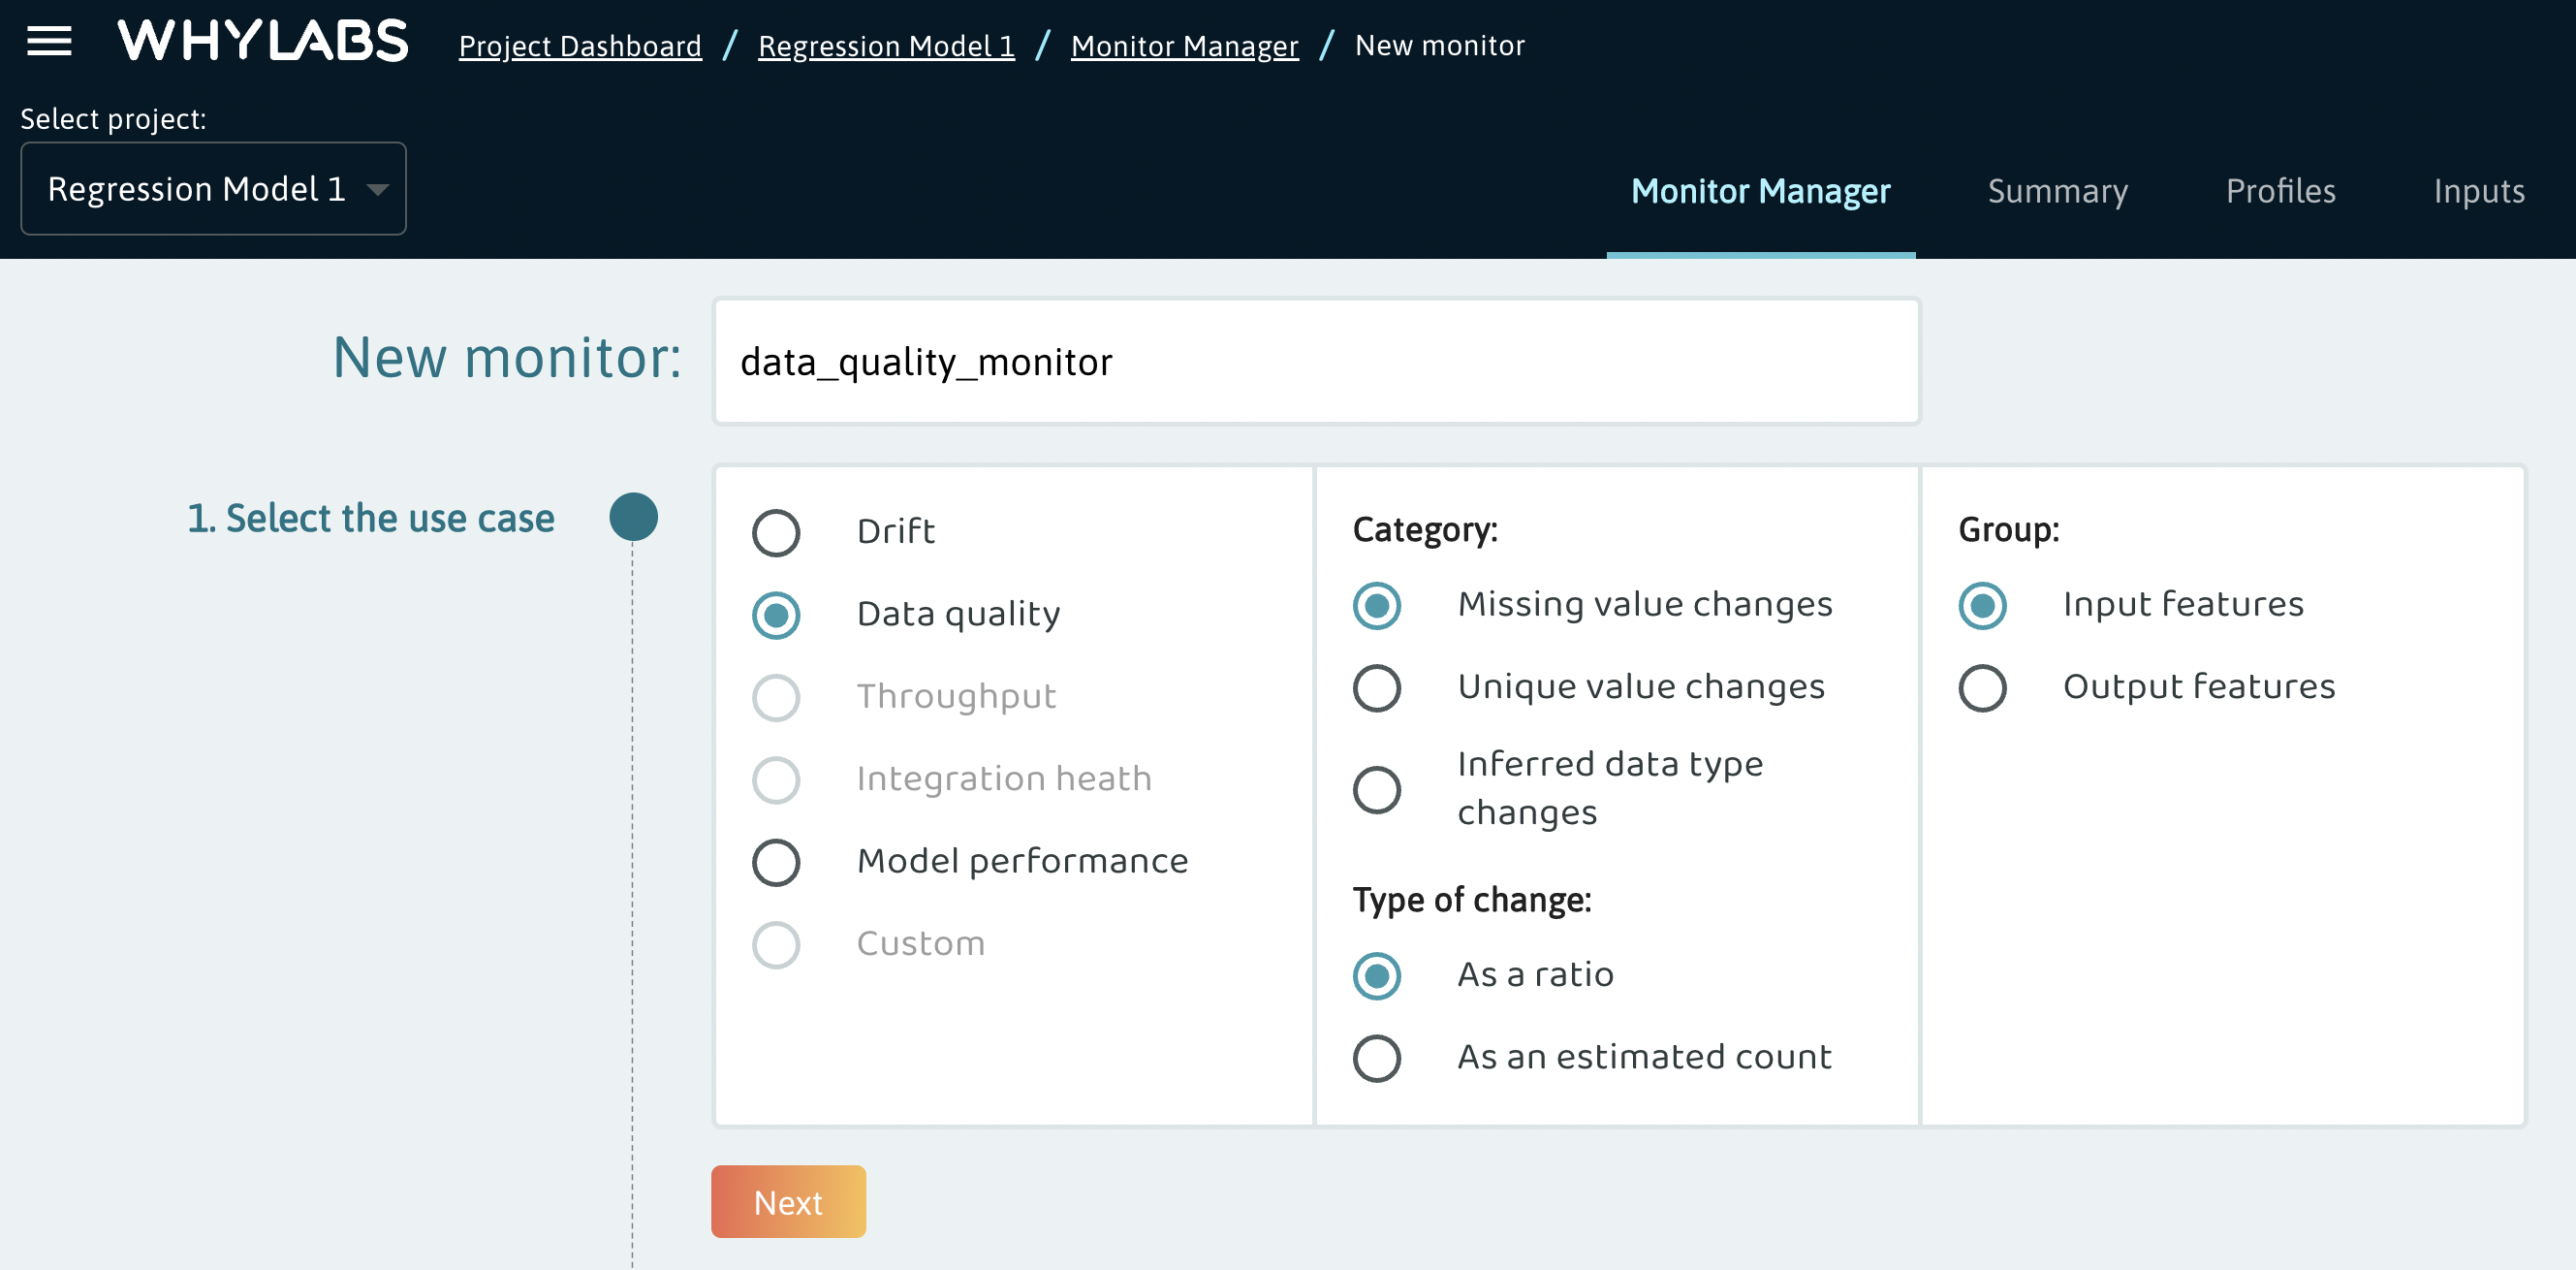
Missing Values & Unique Values
For missing values and unique values, users can either monitor the ratio or estimated count. Choosing a ratio as the type of change is generally preferred for cases in which you expect the number of null values or unique values to be proportional to the number of records for healthy data. On the other hand, suppose you’re interested in monitoring unique values for a feature which should always contain a specific number of unique values regardless of the data volume. In these cases, a unique values monitor based on estimated count is preferred over the estimated unique ratio.
When setting the analysis type for data quality monitors of the missing values and unique values categories, users can choose between a fixed threshold or a user-specified number of standard deviations against the baseline.
Similar to the Drift example, users can specify which features/segments should be targeted by the monitor.
Inferred Data Type
Data quality monitors of the inferred data type changes category will compare the inferred data type of the current profile against the inferred data type of the baseline. The inferred data type is determined by the most frequent data type present for a given feature. For example, if 75% of a feature’s values were detected as the Text type and 25% were detected as Integer types, then the inferred data type for that profile will be Text.
When using a trailing baseline or a specific date range, the baseline’s inferred data type will be determined by the most frequent data type present across the entire trailing window or date range. The data types recognized by WhyLabs include:
- Fractional
- Integer
- Text
- Null
- Boolean
- Unknown
Similar to the Drift example, users can specify which features/segments should be targeted by the monitor.
Baselines
The baseline options for data quality metrics are similar to other monitor types and include the following:
- Trailing window
- Reference profile
- Reference date range
Note that baselines are not relevant for any monitors using a fixed threshold as the analysis type.
Actions
The actions available for data quality monitoring are identical to those in the drift example and include options for specifying the alert severity, custom messages, and notification channels.
Performance Metrics
Users can create monitors to target a particular performance metric. Options for target metrics differ for classification and regression models:
Classification
- Accuracy
- Precision
- Recall
- F1 Score
Regression
- Mean Absolute Error (MAE)
- Mean Squared Error (MSE)
- Root Mean Squared Error (RMSE)
There are multiple options for the type of analysis to be performed:
- Percentage change
- Absolute value change
- Static threshold (upper and lower bounds)
- Standard deviation change
The changes above are relative to the baseline set by the user. When the standard deviation option is selected, the standard deviation is calculated from each of the metric values within the trailing window or date range used by the baseline.
Baselines
The baseline options for data quality metrics are similar to other monitor types and include the following:
- Trailing window
- Reference profile
- Reference date range
Note that baselines are not relevant for any monitors using a static threshold as the analysis type.
Actions
The actions available for data quality monitoring are identical to those in the drift example and include options for specifying the alert severity, custom messages, and notification channels.
Other Metrics
Other monitors, such as integration health and throughput monitors are coming soon. Users are welcome to submit a support request or contact us directly for assistance with setting up monitors which are not yet supported by the UI.
After Setting Up A Monitor
After setting up a monitor, only new data will be analyzed and notified upon. If a user wishes to apply a monitor to historical data, please submit a support request for that model or dataset to be backfilled.

