Dashboards Overview
There are two types of dashboard which are differentiated by their scope in the Observe portion of the platform: ones with organizational scope and ones scoped to a single model or dataset (resource).
Organizational dashboards
These are top level dashboards that enable views into the operational health of all resources (models or datasets) for an organization (account). At the this level, it's possible to create graphs and save them into custom dashboards that are purpose built for organization-wide use cases.
Dedicated "Overall Summary Dashboard" for both models and datasets are also provided at the org level.
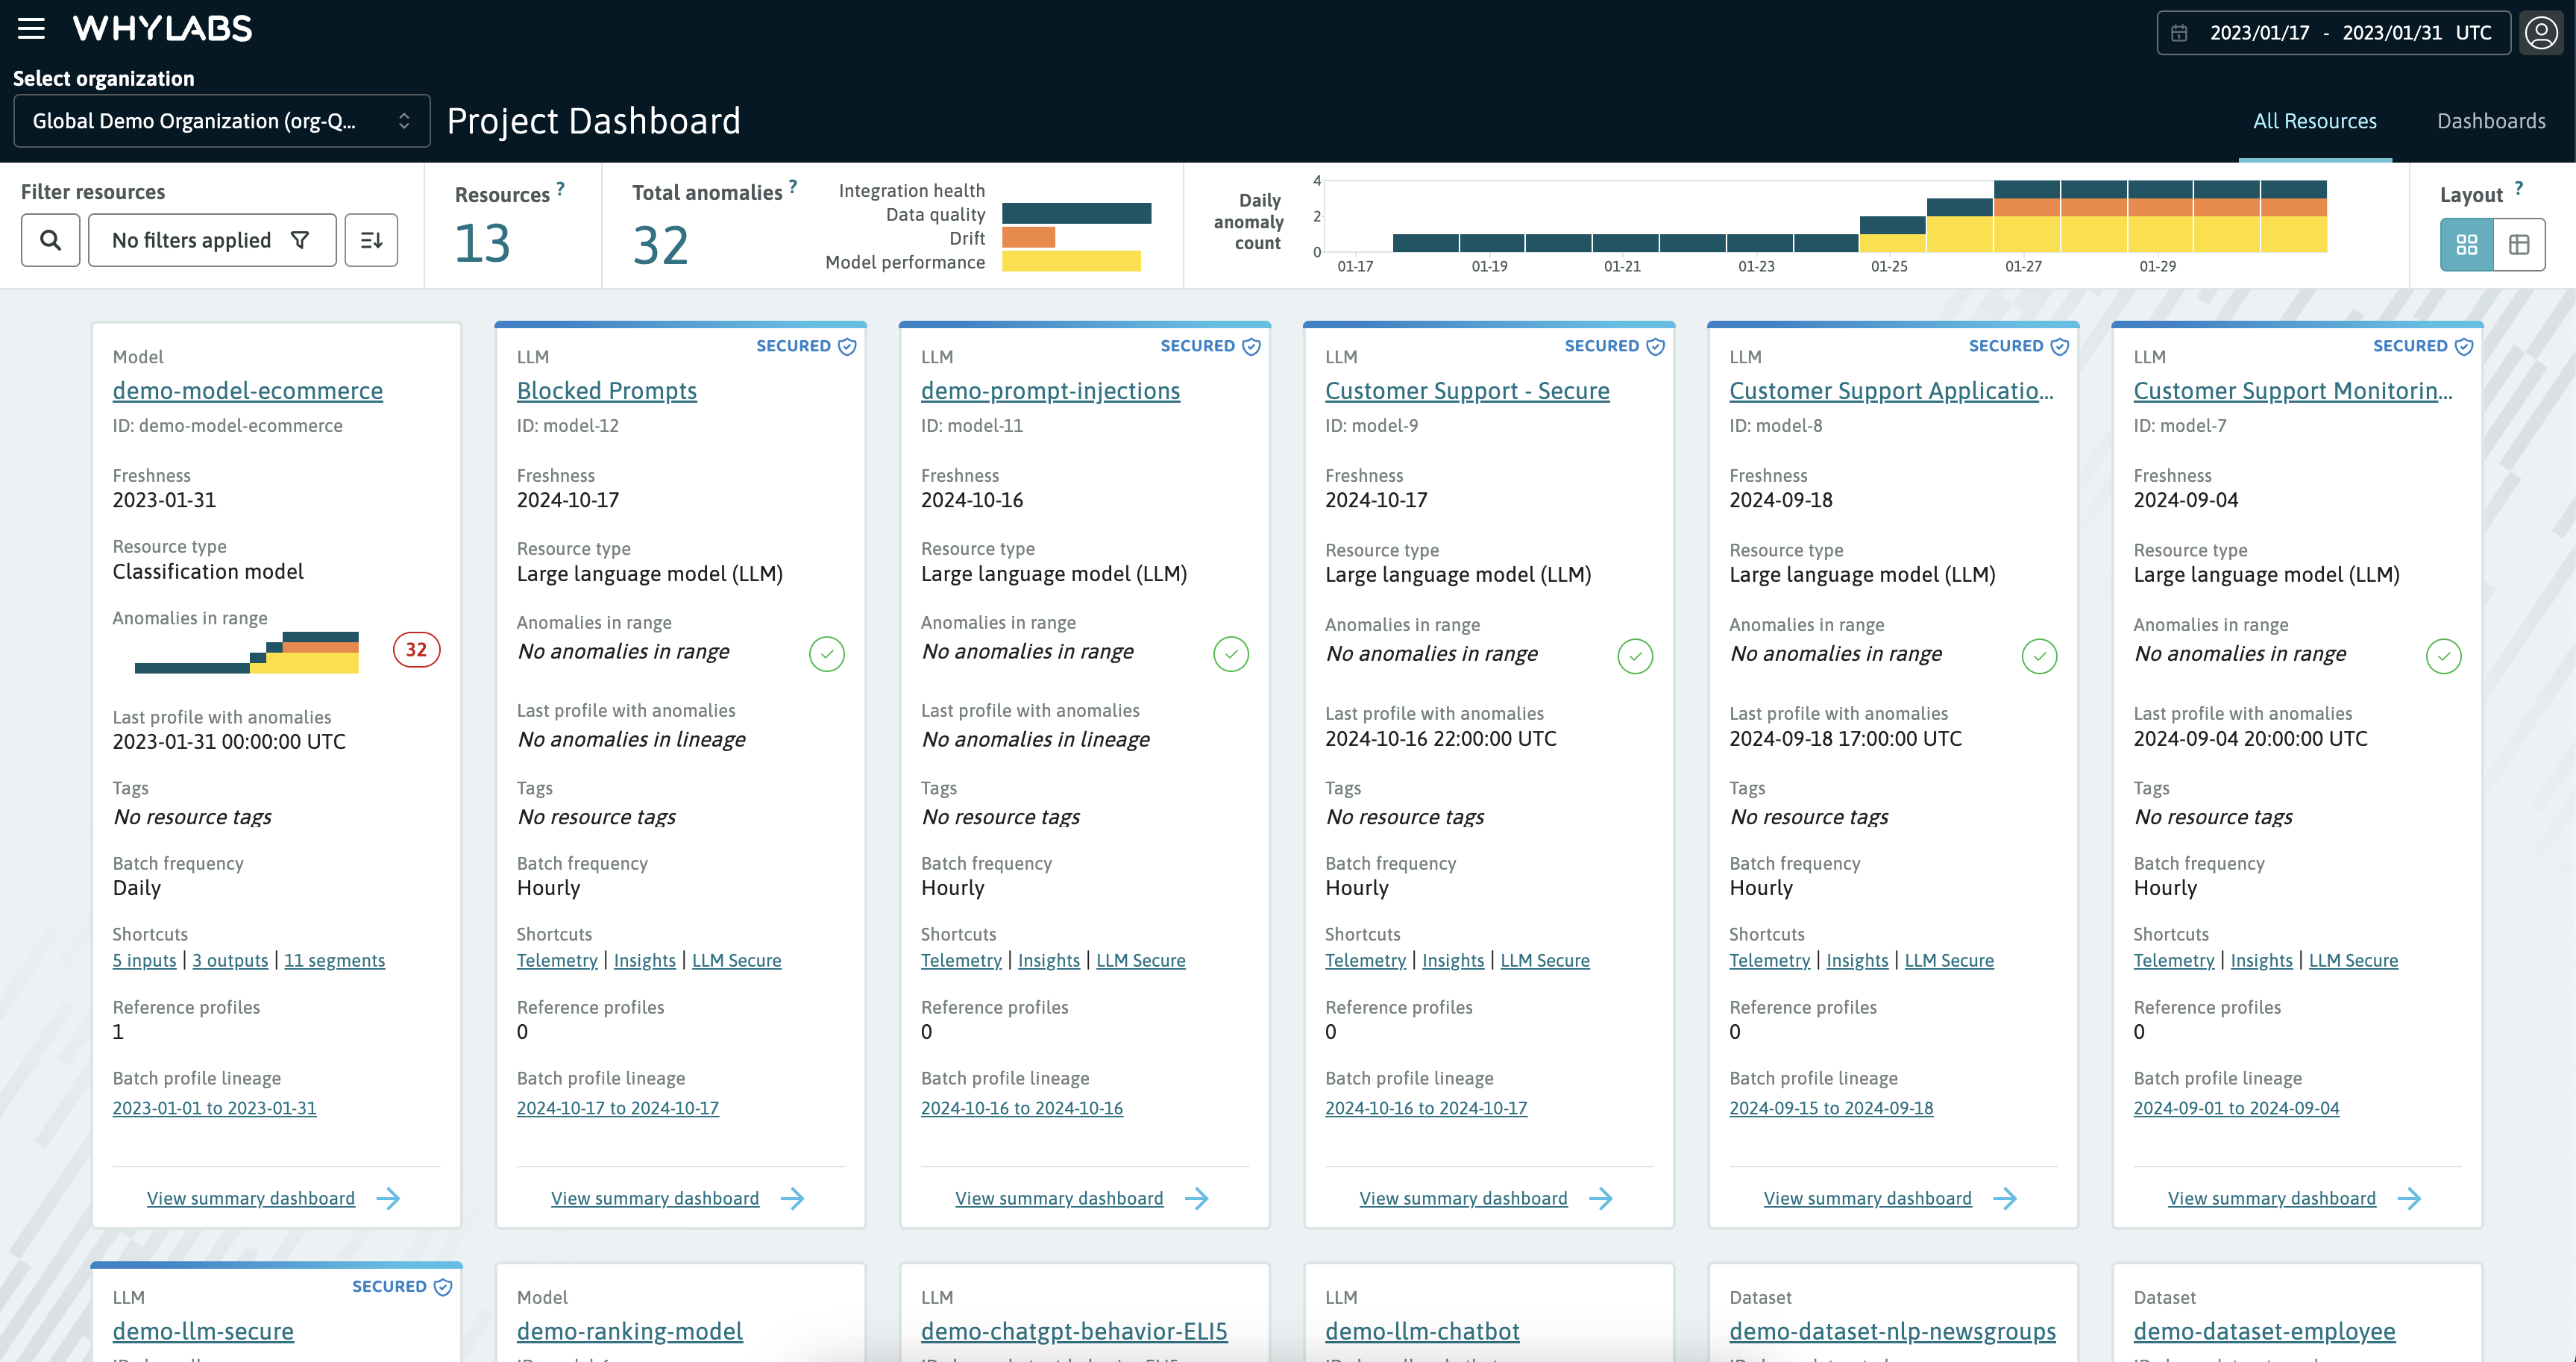
The "All Resources" dashboard provides a quick overview of all resources in the organization, with shortcuts to the individual resource dashboards.
Details and screenshots of the organization dashboards can be found on the Feature Walkthrough page.
Single resource dashboards
The majority of the dashboards are scoped to a single model or dataset. Models and datasets are collectively referred to as "resources" in the platform. To access these dashboards, you must first drill into the specific resource you're interested in.
Resource dashboards are tactical and used mainly by data scientists, ML engineers, data engineers, and product teams to observe, monitor, and debug their resources. They provide rich visualizations of the telemetry that's captured in whylogs profiles, that have been uploaded to the platform.
Details and screenshots of the resource dashboards can be found on the Feature Walkthrough page.
The Project Dashboard
All Resources View
 The Project Dashboard showing the "All Resources" view
This dashboard provides visibility into all resources in an organization and can be considered the "home page" for an org. It has two sections/views. The default is the "All Resources" view, which provides a high-level overview of all resources in the organization. The second view is the "Dashboards" view, which provides access to custom dashboards and overall summary dashboards.
A detailed overview of the Project Dashboard can be found at the start of the Feature Walkthrough page, so it won't be repeated here.
💡 If you have a model or dataset that is no longer reporting data, but you would like to zoom into the time period when it did report data, click the link under “Profile lineage” to zoom into that time frame.
💡 There are controls for quickly renaming and deleting resources in the All Resource dashboard, making it easy to tidy-up the dashboard.
Accessing other org-level dashboards
To access other org-level dashboards from the Project Dashboard click on the "Dashboards" tab located on the right side of the WhyLabs header. From there you will be able to access two types of additional dashboard views with org-wide scope:
The default tab is for Custom dashboards. This tab lists all custom dashboards that have been created by users in the organization, and provides the ability to create new custom dashboards.
- These user-defined dashboards can be created and saved for specific use cases not covered by the default dashboards
- They enable users to quickly create custom views of data that is most important to them, such as resource and segment comparisons
The other tabs are for Overall summary dashboards. There is an overall summary dashboard for both datasets and models.
Overall summary dashboards
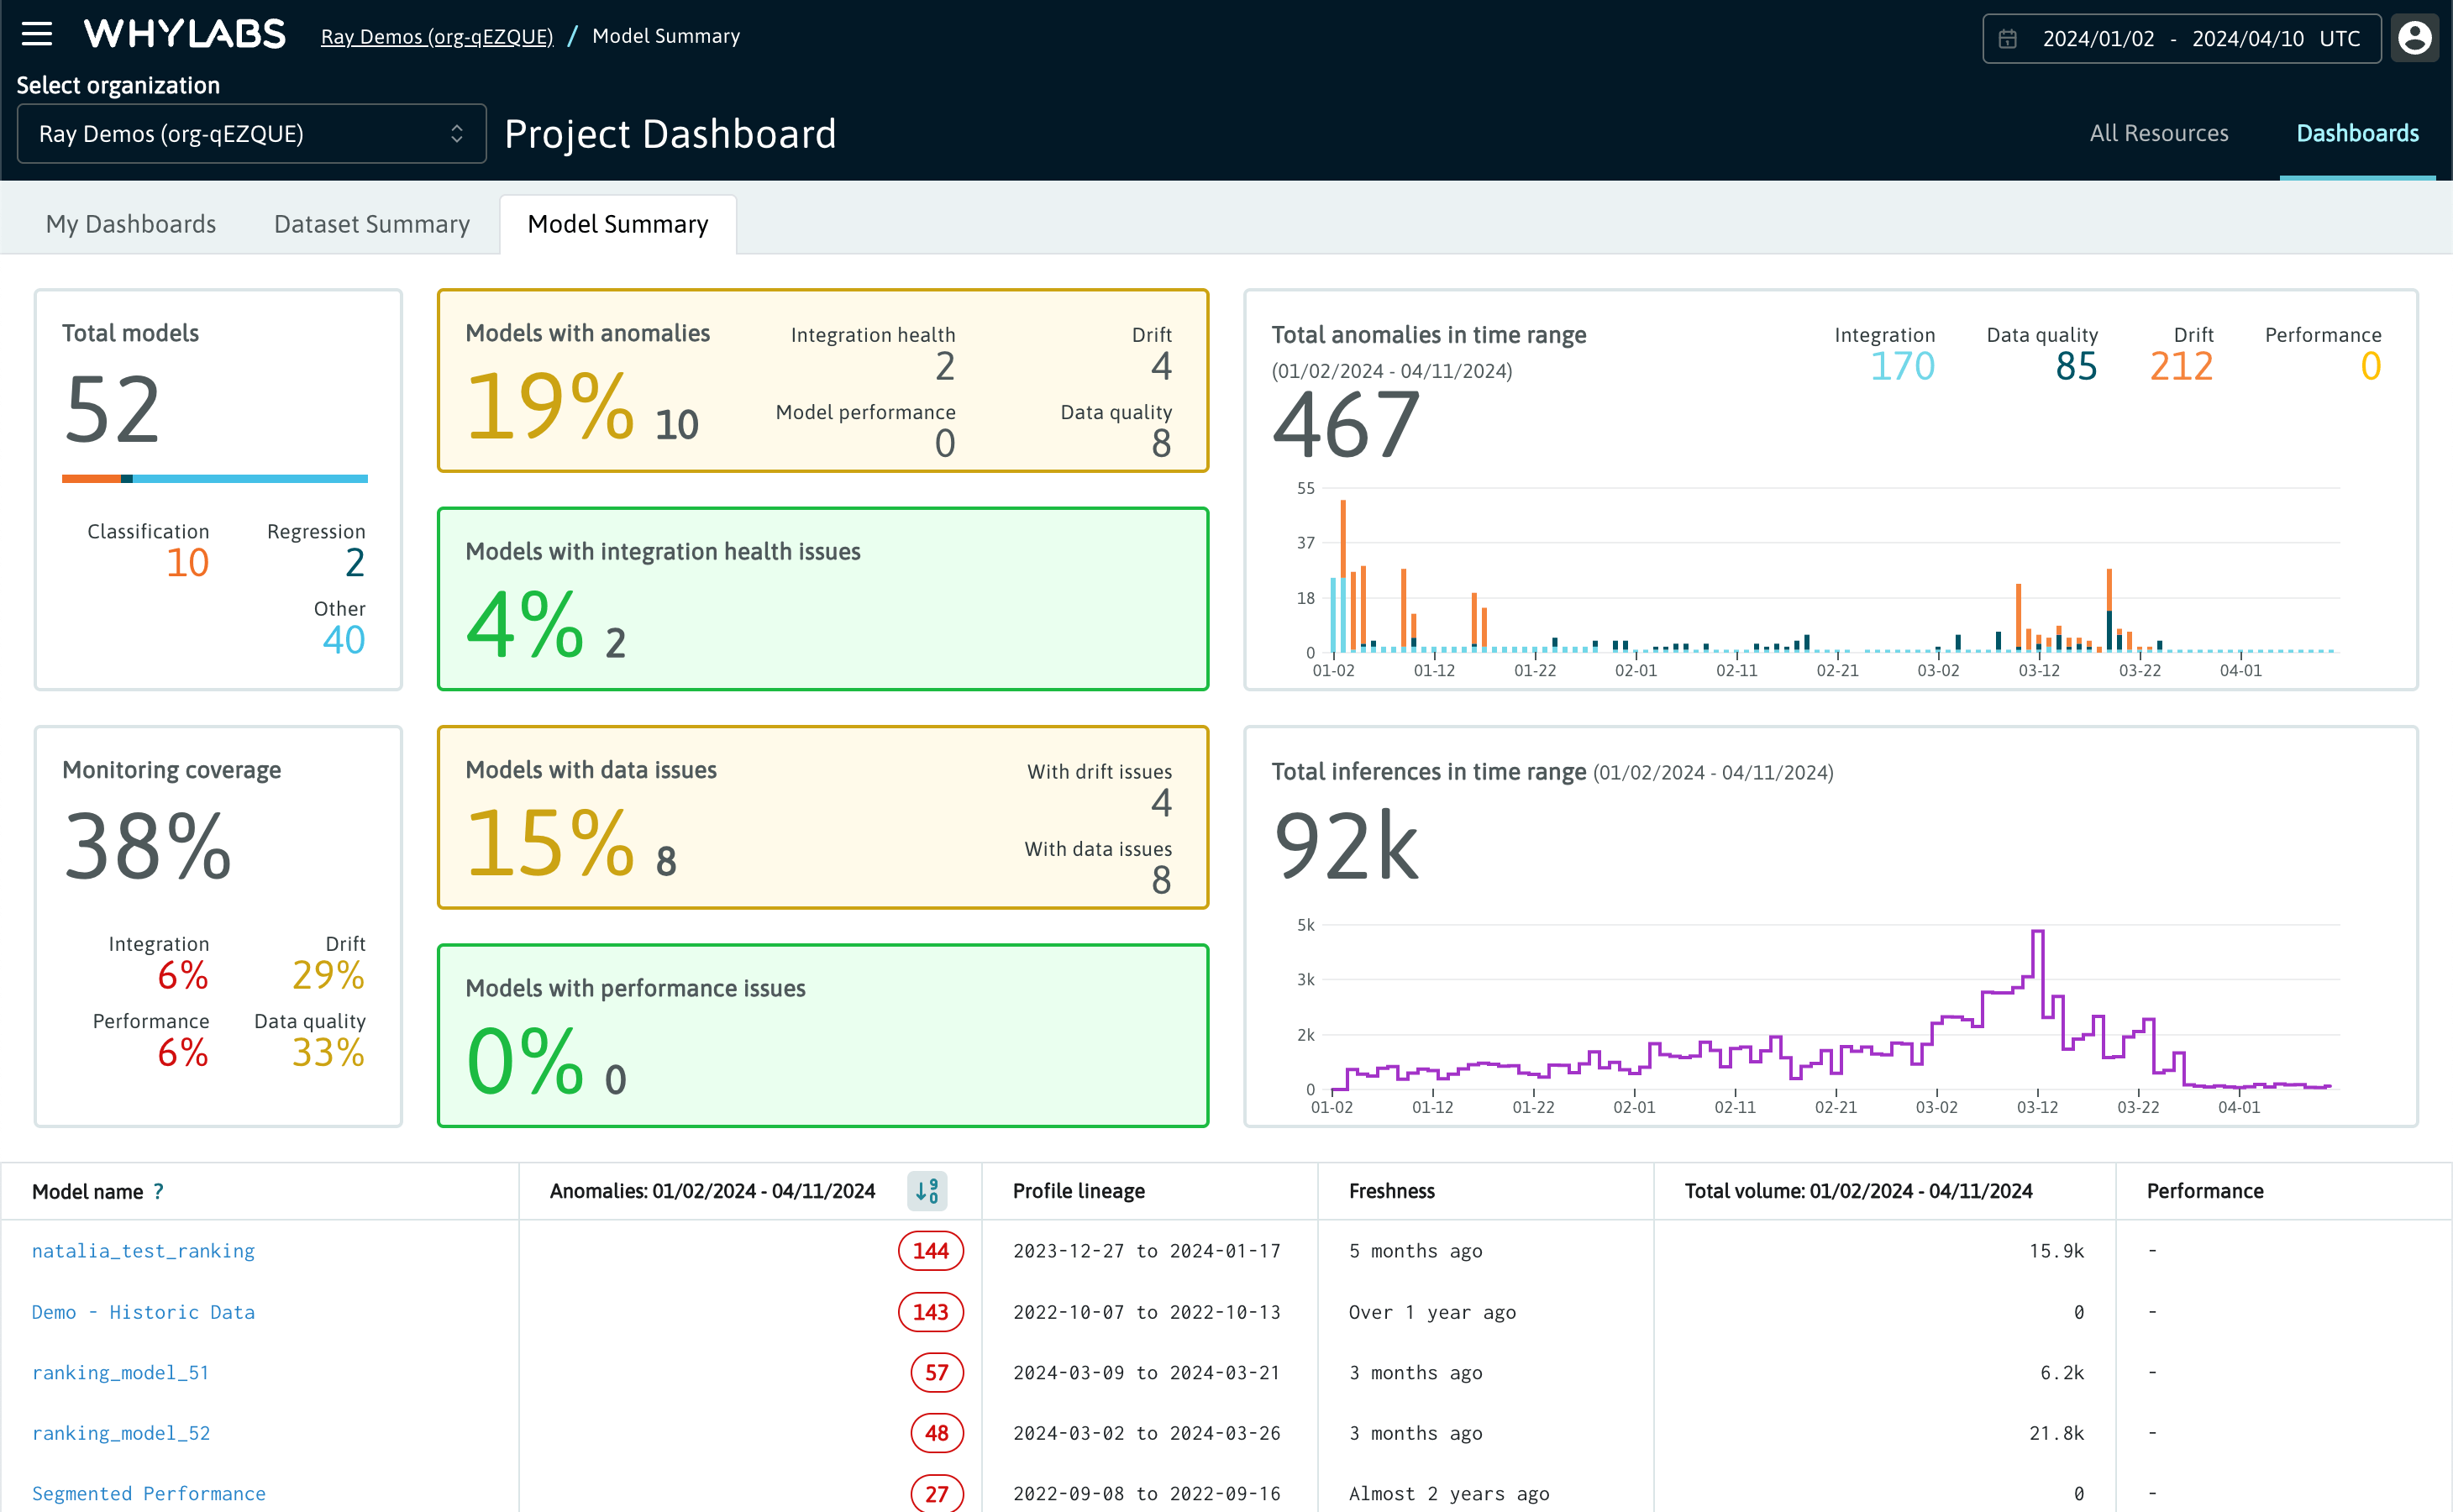
 Overall Summary dashboard for models
The Overall Summary dashboards give a rolled-up view of all datasets and models that are tracked by the organization in WhyLabs. They surface core insights about the health of all the resources in the organization, and other key metrics that are tracked by the platform.
Summary views into all resources that belong to an organization are typically used for reporting operational health at weekly and monthly business review or ops meetings.
More information about of the Overall Summary dashboards can be found on the Feature Walkthrough page.
this dashboard provides a high-level overview of all datasets in the organization. It includes data quality, data drift, and data ingestion metrics.
Custom dashboards
The WhyLabs Control Center includes powerful custom dashboard capabilities that are easy to use and enable users to create custom views of data that are most important to them.
Head to the Custom Dashboards page to learn more about how to create and manage custom dashboards.

