Performance Metrics
In addition to profiling inputs and outputs of ML models, WhyLabs can automatically track a variety of model performance metrics. This is true even for delayed or partial ground truth, a common scenario in production ML systems. This means that at any point of time we can upload or update the model's performance metrics by assigning the appropriate timestamp.
The only thing you'll need to do in order to populate the Performance dashboard is to profile your predictions, targets (i.e. ground truth) and, optionally, output scores. Based on the submitted data, a range of performance metrics is calculated and uploaded to WhyLabs.
The columns containing the predictions, targets and scores aren't logged to WhyLabs unless explicitly specified. The only exception in terms of this behavior is pyspark whylogs v0 - this version is including the columns used for calculating the performance metrics in the profile.
Note: if you'd like to add your own performance metrics in addition to the out-of-the-box ones, read this section about custom performance metrics.
Settings in WhyLabs
In order to use this feature, select the type of model you want to log performance metrics for. You can set the resource type when creating a new model from the Dataset and Model Management section in Settings. WhyLabs supports:
- Classification models
- Embeddings models
- Large Language Models (LLMs)
- Ranking models
- Regression models
For models types not covered by the list of available models, select Other model.
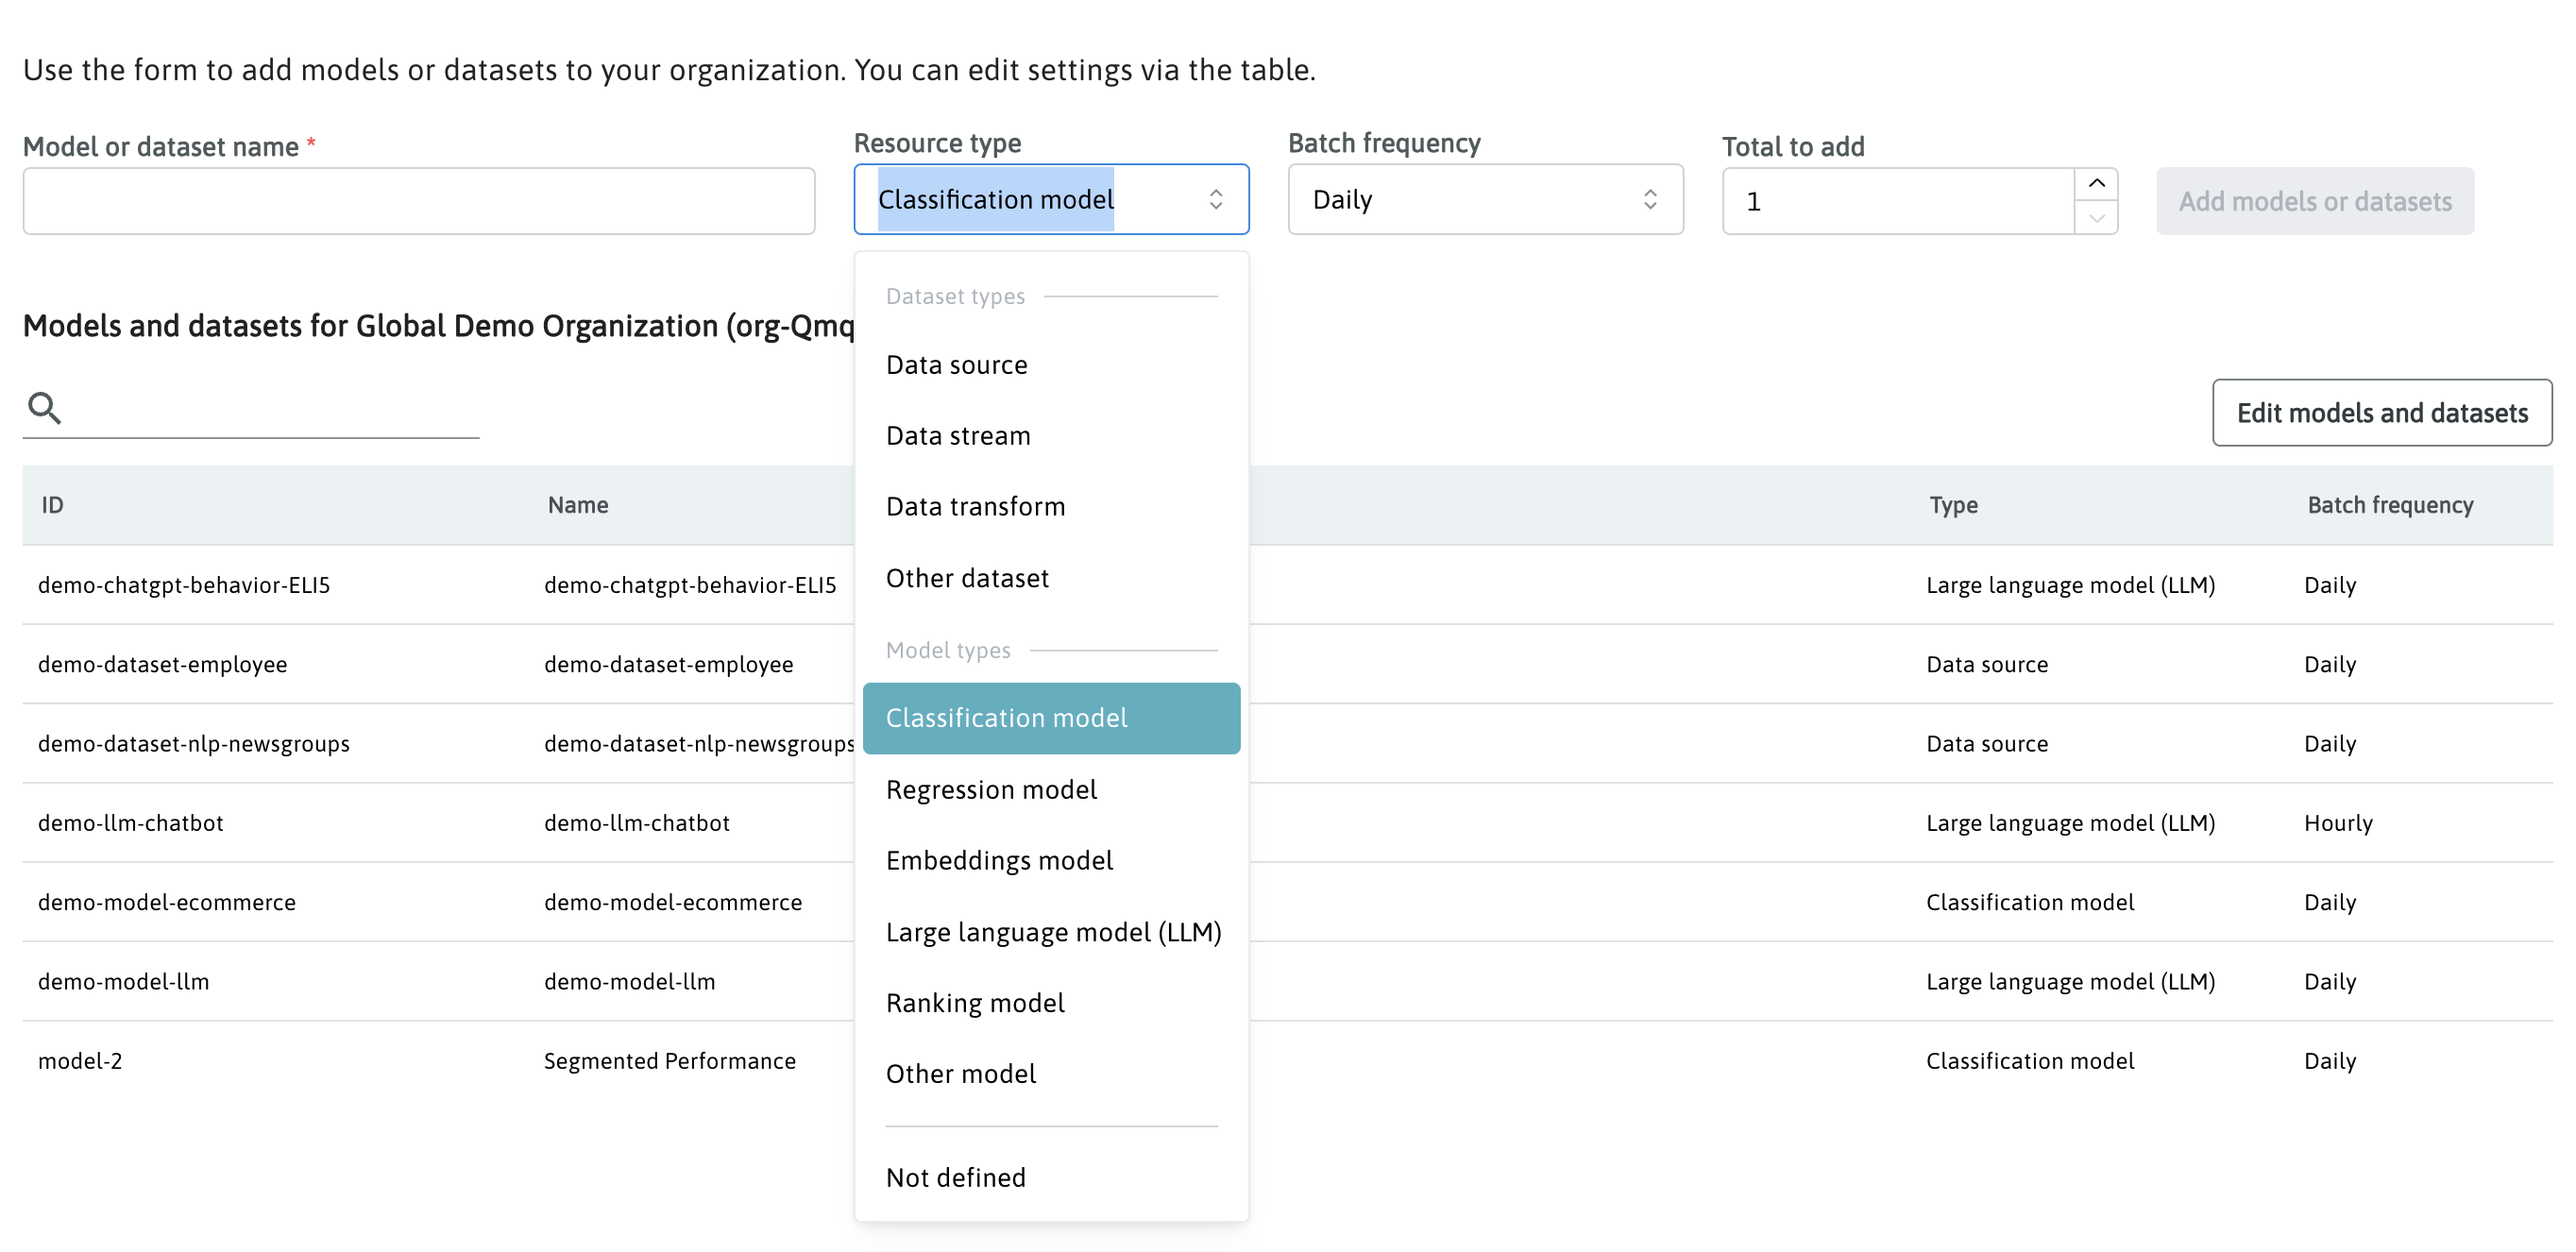
For any models already assigned the “Unknown” or "Other model" type, you can update the model type by editing the settings in the Dataset and Model Management section within Settings.
Logging model performance
Before logging, you must ensure that all actuals and predictions are valid; no nulls, Nones, or NaNs. For example, if your data is in a Pandas dataframe, use the following:
model_perf_df.dropna(axis=0, inplace=True)
In whylogs v1 the predictions and targets (and any other columns contained in the passed model_perf_df) won't be logged to WhyLabs unless you pass an additional argument log_full_data=True. The pyspark whylogs v0 package includes the columns used for calculating the performance metrics in the profile by default.
In case you have already logged the predictions at the model inference time (very often we see it published along with model inputs) and wish to publish the targets column only, log it using the standard log() function as shown below:
targets = why.log(pd.DataFrame(df["output_target"]))
targets_profile = targets.profile()
targets_profile.set_dataset_timestamp(dataset_timestamp)
targets.writer("whylabs").write()
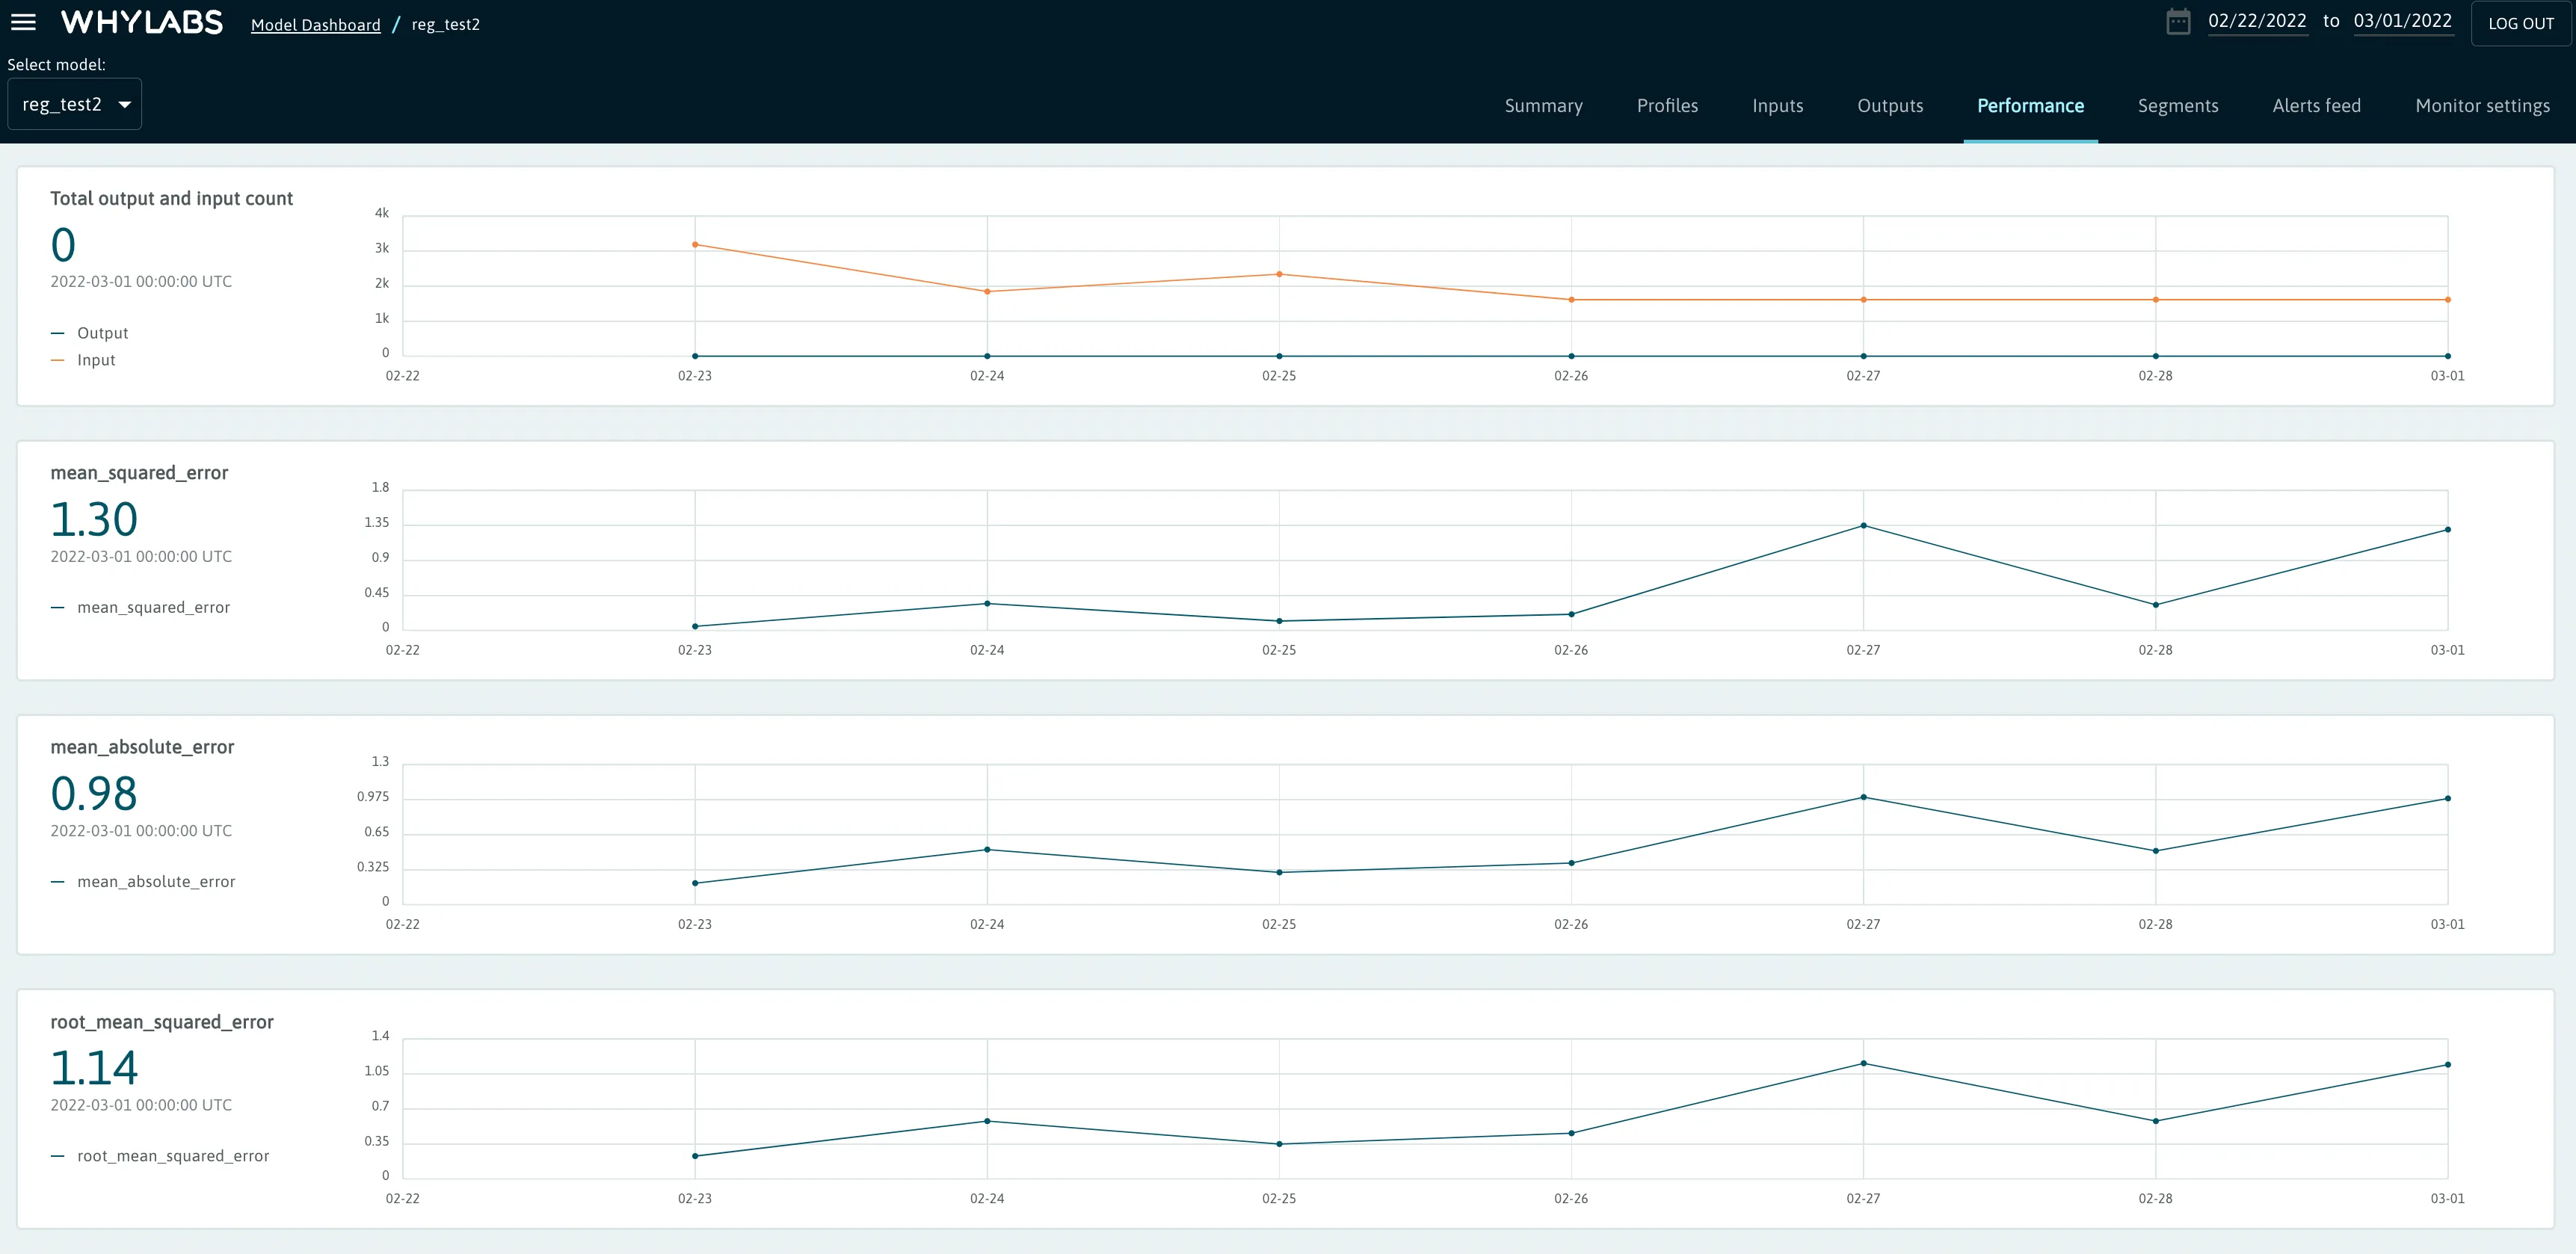
Regression
In the case of regression models, the following metrics are tracked:
- Total output and input count
- Mean Squared Error
- Mean Absolute Error
- Root Mean Squared Error
When logging performance metrics for Regression Models, the following code can be used.
- whylogs v0
- whylogs v1
- pyspark whylogs v0
# whylogs v0.x can be installed via the following
# pip install "whylogs<1.0"

import pandas as pd
import os
from whylogs.app import Session
from whylogs.app.writers import WhyLabsWriter
from whylogs.proto import ModelType

os.environ["WHYLABS_API_KEY"] = 'YOUR-ORG-ID'
os.environ["WHYLABS_DEFAULT_ORG_ID"] = 'YOUR-API-KEY'
model_id='YOUR-MODEL-ID'

df = pd.read_csv("path/to/your/data.csv")

# initialize writer object
writer = WhyLabsWriter()
# start session
session = Session(project="demo-project", pipeline="demo-pipeline", writers=[writer])

# log performance metrics
with session.logger(tags={"datasetId": model_id}) as ylog:
    ylog.log_metrics(
        targets= model_targets_list,
        predictions=model_predictions_list,
        prediction_field="pred_vals",
        target_field="target_vals",
        model_type=ModelType.REGRESSION
    )
# install whylogs with the whylabs extra
# pip install -q whylogs[whylabs]

import os
import pandas as pd
import whylogs as why

os.environ["WHYLABS_DEFAULT_ORG_ID"] = 'YOUR-ORG-ID'
os.environ["WHYLABS_API_KEY"] = 'YOUR-API-KEY'
os.environ["WHYLABS_DEFAULT_DATASET_ID"] = 'YOUR-MODEL-ID'

# dataset containing targets and predictions
df = pd.read_csv("path/to/your/data.csv")

# Use 'output' in column name to log metrics as outputs (optional)
results = why.log_regression_metrics(df,
                                     target_column = "targets_output",
                                     prediction_column = "preds_output")

# set dataset_timestamp using a datetime object (optional)
profile = results.profile()
profile.set_dataset_timestamp(dataset_timestamp)

# write profile to whylabs
results.writer("whylabs").write()
# Note: Logging performance metrics is not yet supported by whylogs v1
# whylogs v0.x can be installed via the following
# pip install "whylogs<1.0"

from whyspark import new_profiling_session
import pandas as pd

%env WHYLABS_API_KEY="YOUR_API_KEY"
%env WHYLABS_ORG_ID="YOUR_ORG_ID"
%env WHYLABS_MODEL_ID="YOUR_MODEL_ID"

# read in file and create spark dataframe
pandas_df = pd.read_parquet("path/to/file.parquet")
spark_df = spark.createDataFrame(pandas_df)

# initiate session and log metrics
session = new_profiling_session(spark_df, "YOUR_MODEL_NAME")
classificationSession = session.withTimeColumn('TIMESTAMP_COLUMN') \
        .withClassificationModel("PREDICTIONS_COLUMN", "ACTUALS_COLUMN", "SCORES_COLUMN")
classificationSession.log()
Similar to other logging methods, users can optionally provide a dataset_timestamp parameter when initializing the logger in cases where backfilling is required.
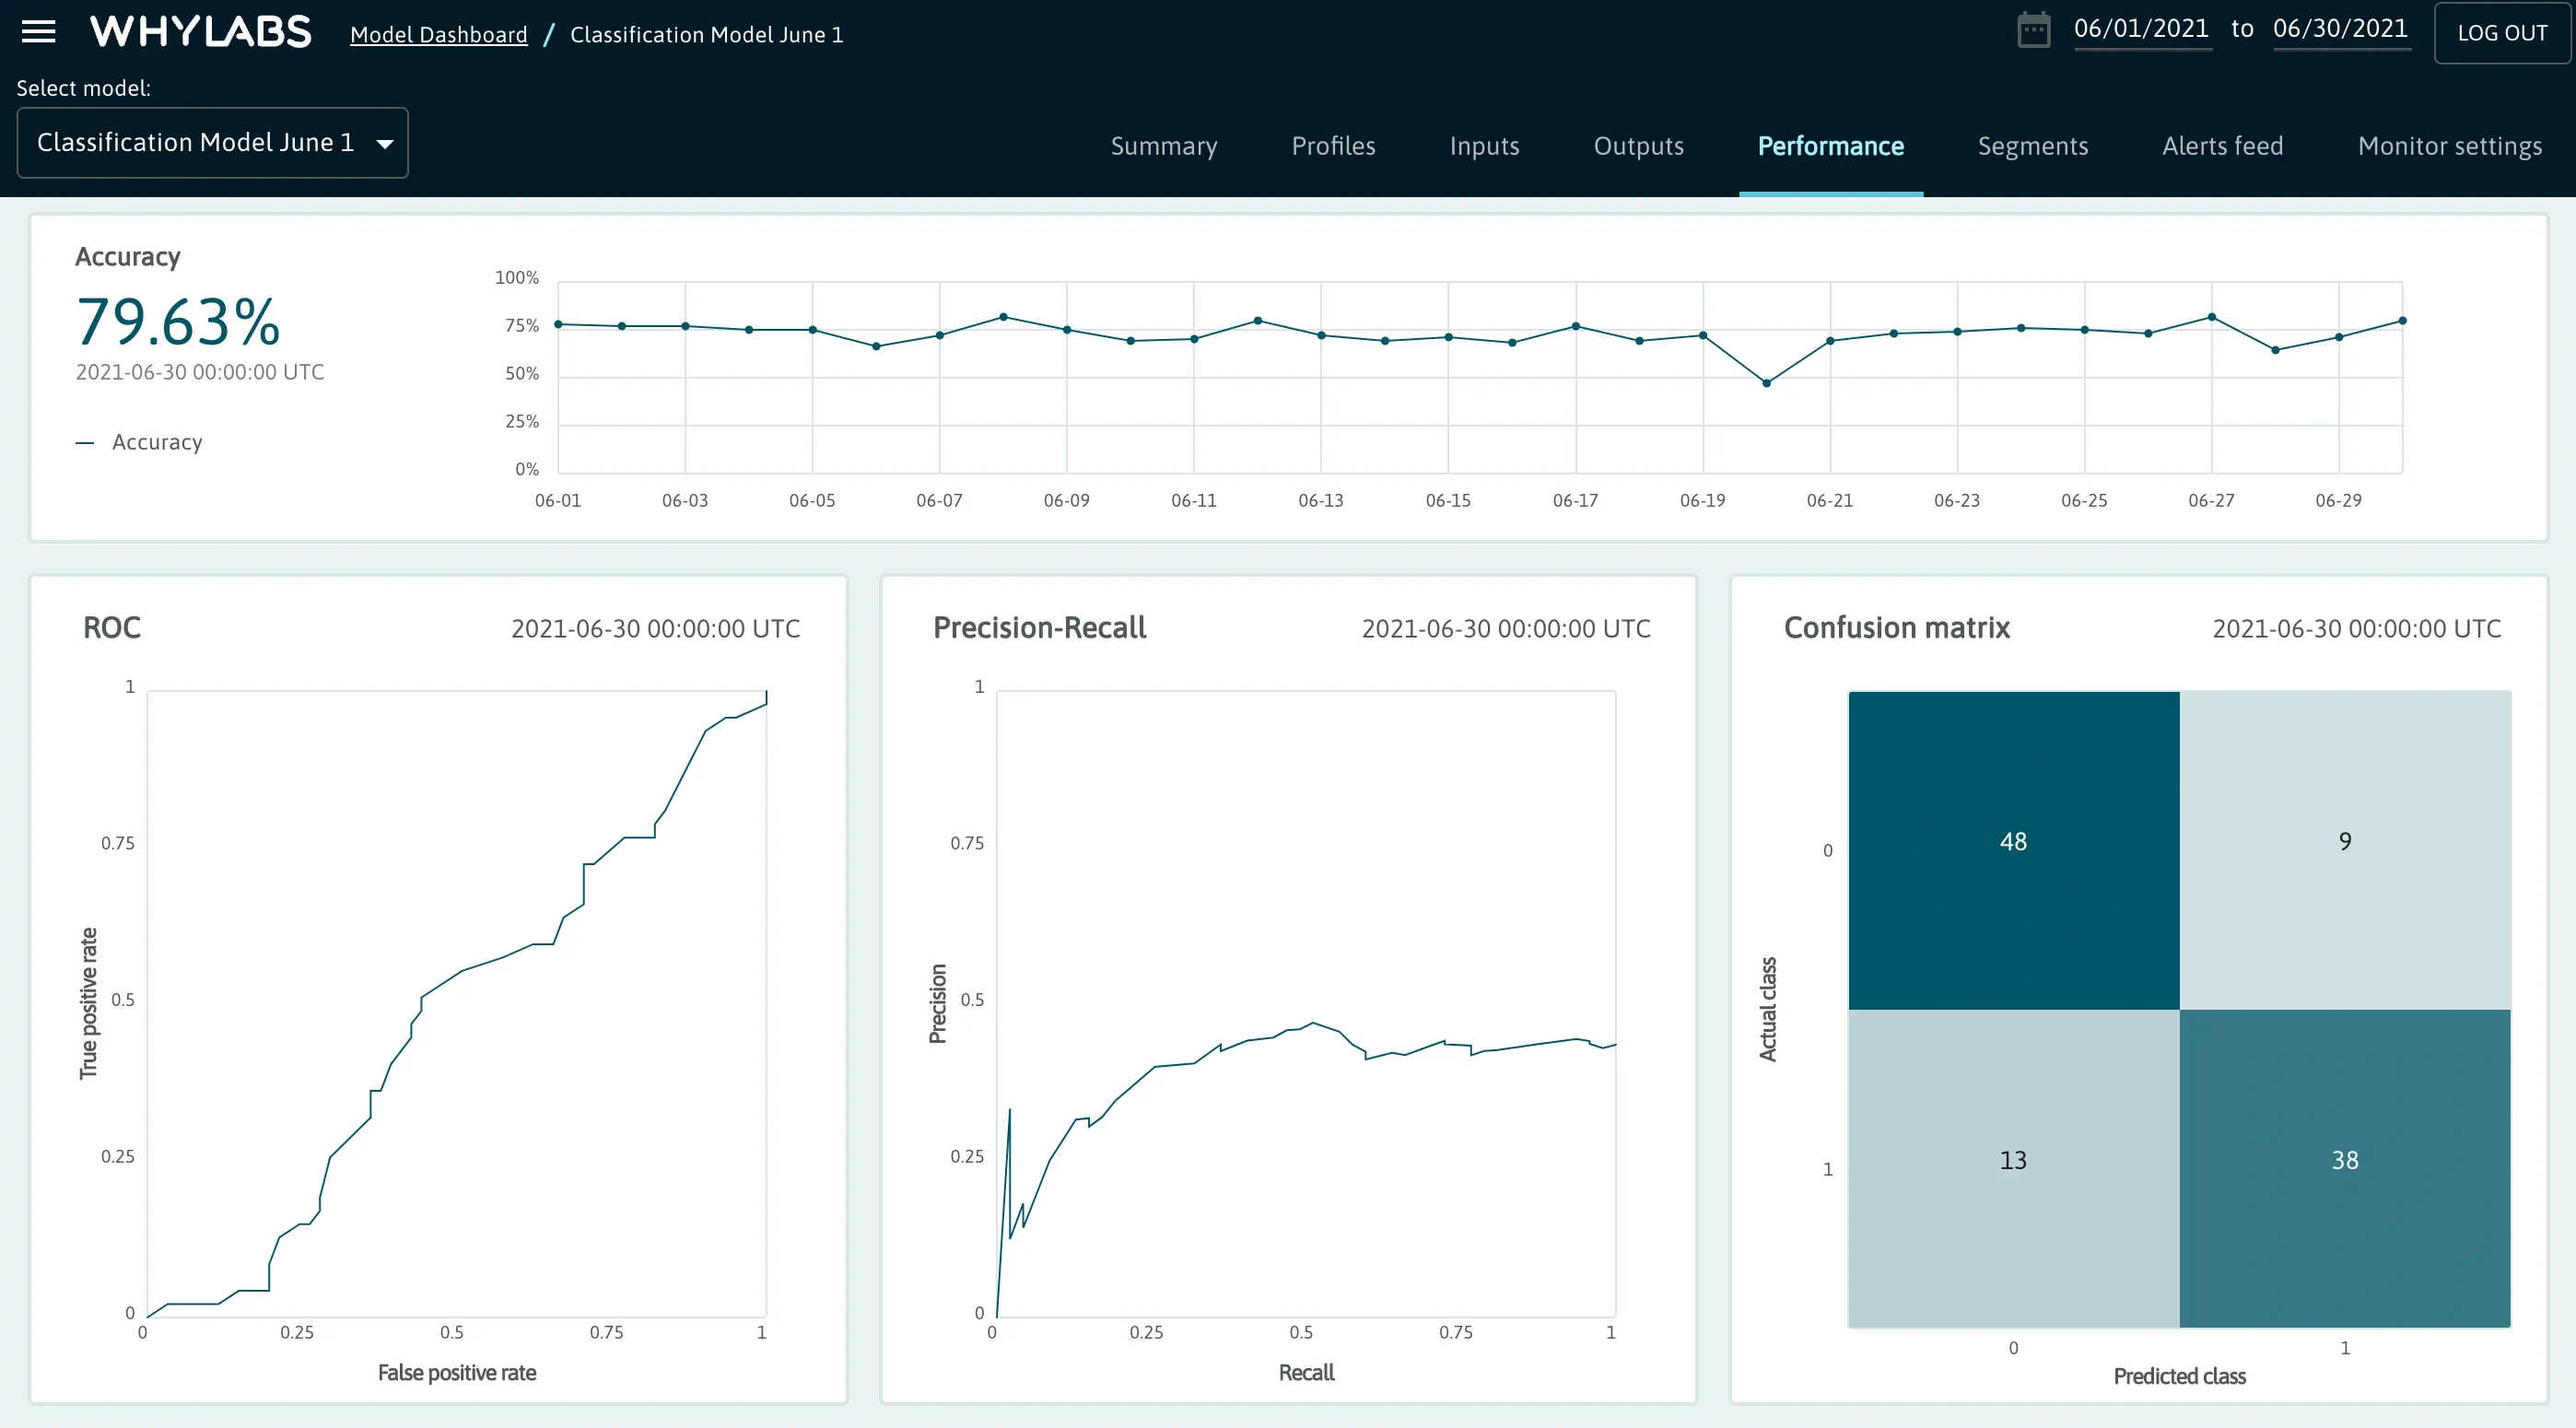
Classification
In the case of classification models, the following metrics are tracked:
- Total output and input count
- Accuracy
- ROC
- Precision-Recall chart
- Confusion Matrix
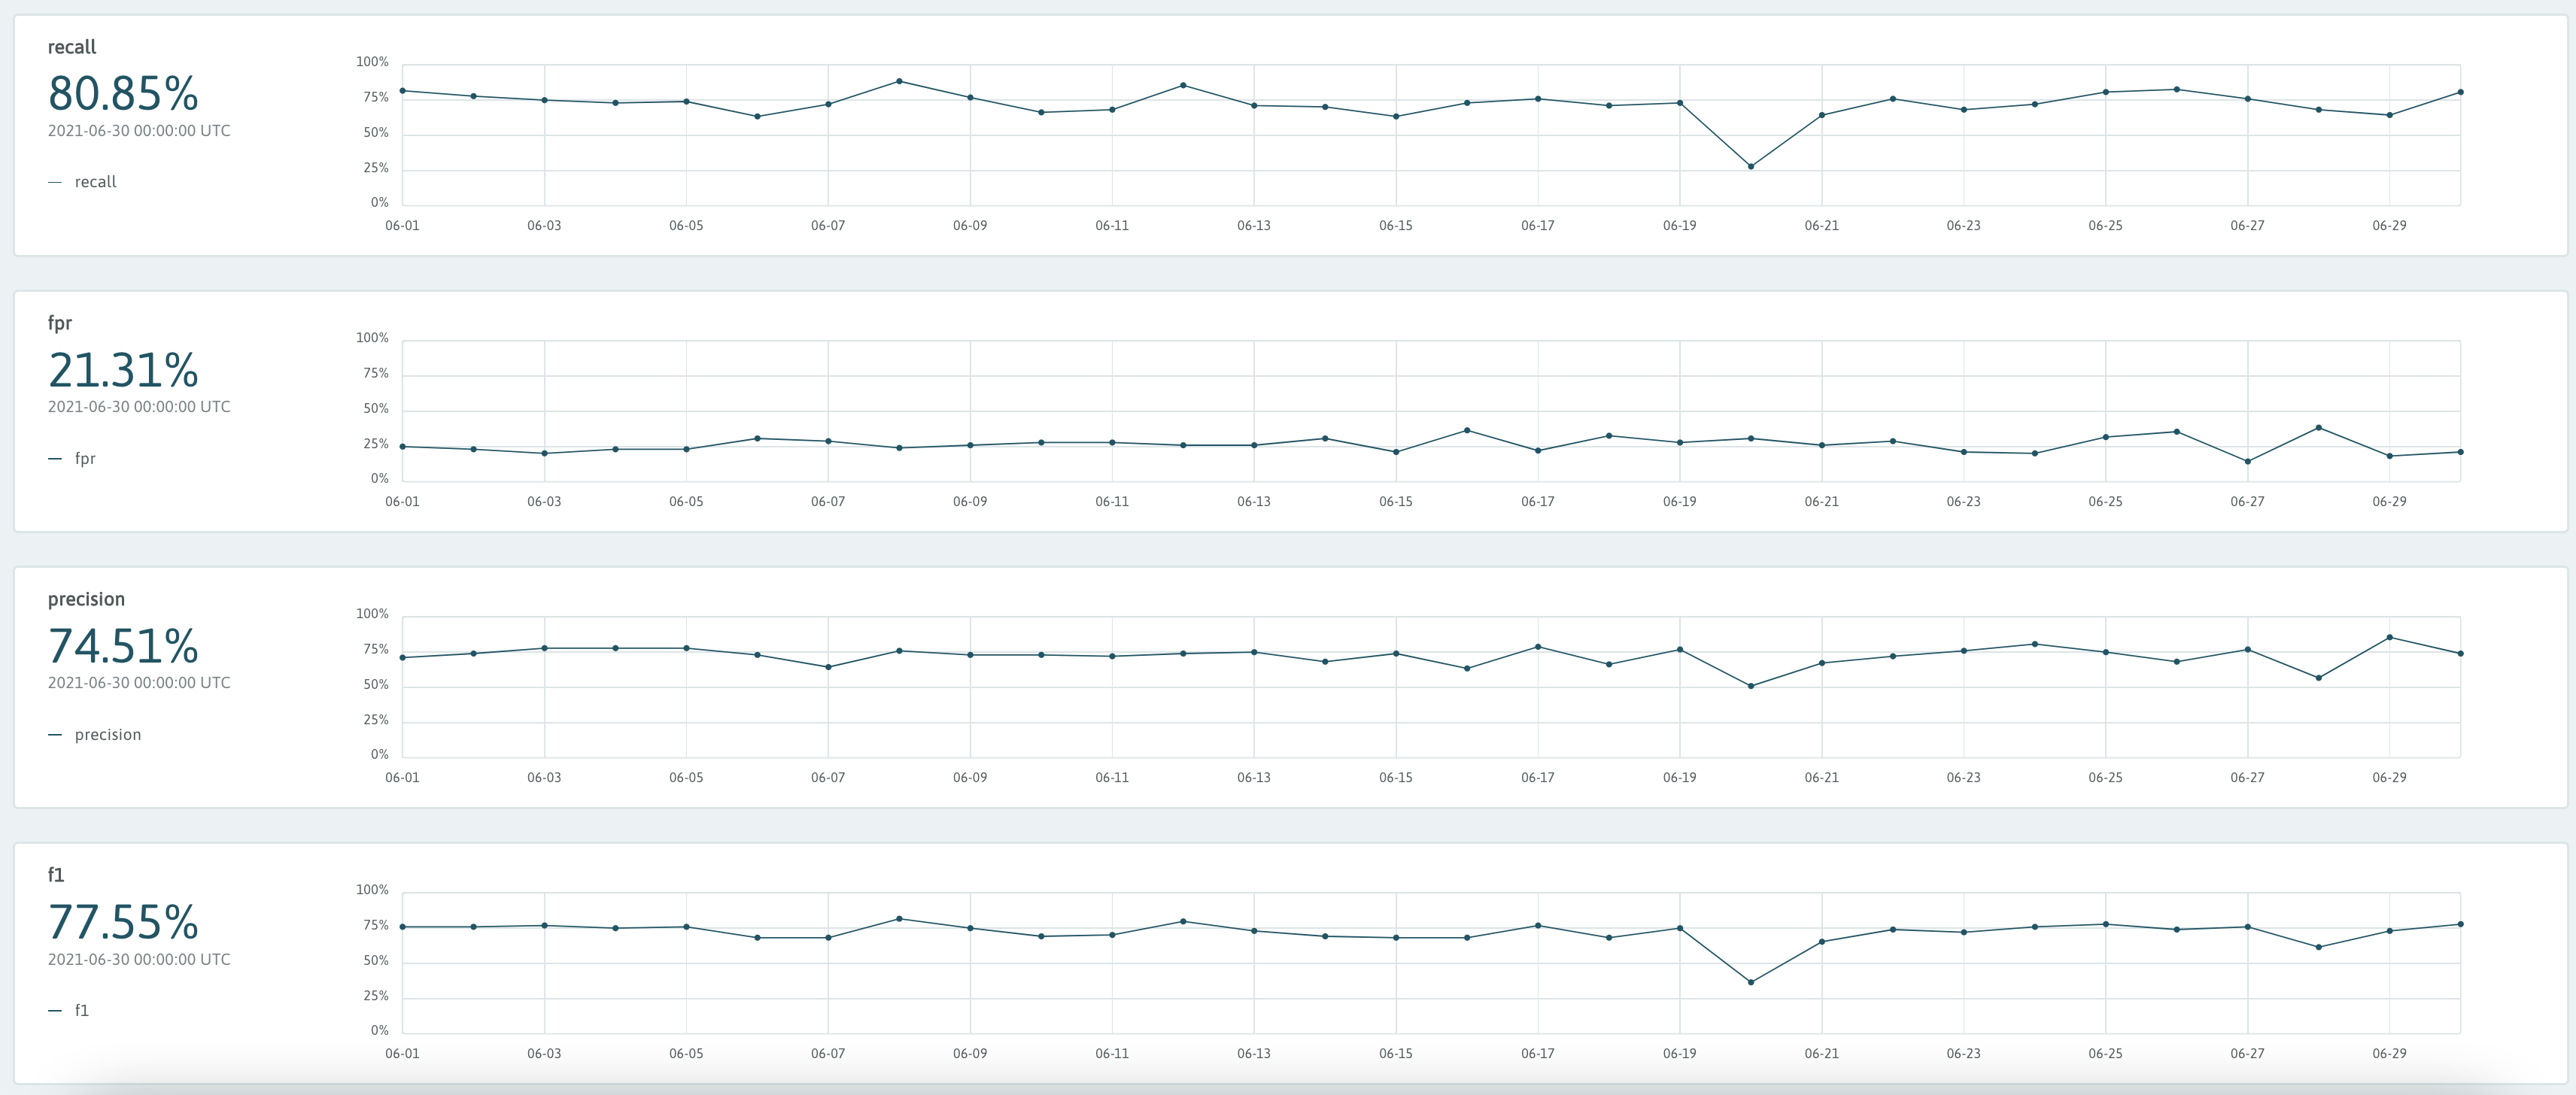
- Recall
- FPR (false positive rate)
- Precision
- F1
The metrics above are supported for both binary classification and multi-class classification.
Note: To populate the ROC curves and AUC metrics a threshold score column needs to be included in addition to predictions and targets. The score column could contain the probability of the winning class, confidence, distance to decision boundary, etc.
The code for logging classification metrics is similar to that of regression, with the optional addition of scores associated with each prediction. The scores must be for the positive label for the task, not the score for the individual prediction chosen. This score is often class probability, confidence score, or distance to decision boundary and can take on any numeric value.
- whylogs v0
- whylogs v1
- pyspark whylogs v0
# whylogs v0.x can be installed via the following
# pip install "whylogs<1.0"

with session.logger(tags={"datasetId": model_id}) as ylog:
    ylog.log_metrics(
        targets= model_targets_list,
        predictions=model_predictions_list,
        scores=model_scores,
        prediction_field="pred_vals",
        target_field="target_vals",
        score_field="score_vals",
        model_type=ModelType.CLASSIFICATION
    )
# install whylogs with the whylabs extra
# pip install -q whylogs[whylabs]

import os
import pandas as pd
import whylogs as why

os.environ["WHYLABS_DEFAULT_ORG_ID"] = 'YOUR-ORG-ID'
os.environ["WHYLABS_API_KEY"] = 'YOUR-API-KEY'
os.environ["WHYLABS_DEFAULT_DATASET_ID"] = 'YOUR-MODEL-ID'

# dataset containing targets and predictions
df = pd.read_csv("path/to/your/data.csv")

# Use 'output' in column name to log metrics as outputs (optional)
results = why.log_classification_metrics(df,
                                     target_column = "targets_output",
                                     prediction_column = "preds_output",
                                     score_column = "scores_output") #optional

# set dataset_timestamp using a datetime object (optional)
profile = results.profile()
profile.set_dataset_timestamp(dataset_timestamp)

# write profile to whylabs
results.writer("whylabs").write()
# Note: Logging performance metrics is not yet supported by whylogs v1
# whylogs v0.x can be installed via the following
# pip install "whylogs<1.0"

from whyspark import new_profiling_session
import pandas as pd

%env WHYLABS_API_KEY="YOUR_API_KEY"
%env WHYLABS_ORG_ID="YOUR_ORG_ID"
%env WHYLABS_MODEL_ID="YOUR_MODEL_ID"

# read in file and create spark dataframe
pandas_df = pd.read_parquet("path/to/file.parquet")
spark_df = spark.createDataFrame(pandas_df)

# initiate session and log metrics
session = new_profiling_session(spark_df, "YOUR_MODEL_NAME")
classificationSession = session.withTimeColumn('TIMESTAMP_COLUMN') \
    .withClassificationModel("PREDICTIONS_COLUMN", "ACTUALS_COLUMN", "SCORES_COLUMN")
classificationSession.log()
Ranking
In the case of ranking models the following metrics are automatically computed for each result set:
- Average Precision @ K
- Reciprocal Rank
- NDCG @ K
- Precision @ K
- Recall @ K
- Top rank
- Gain sum @ K
Subsequently, based on the performance values on the result set level, the batch profiles are created by extracting the statistical properties of the metrics across multiple rows. This enables monitoring the value distribution, minimum, maximum, mean, etc., granting more visibility into the ranking quality than just tracking single value metrics like Mean Reciprocal Rank.
Once the profiles are uploaded to the WhyLabs platform, the ranking metrics can be inspected on the following pages:
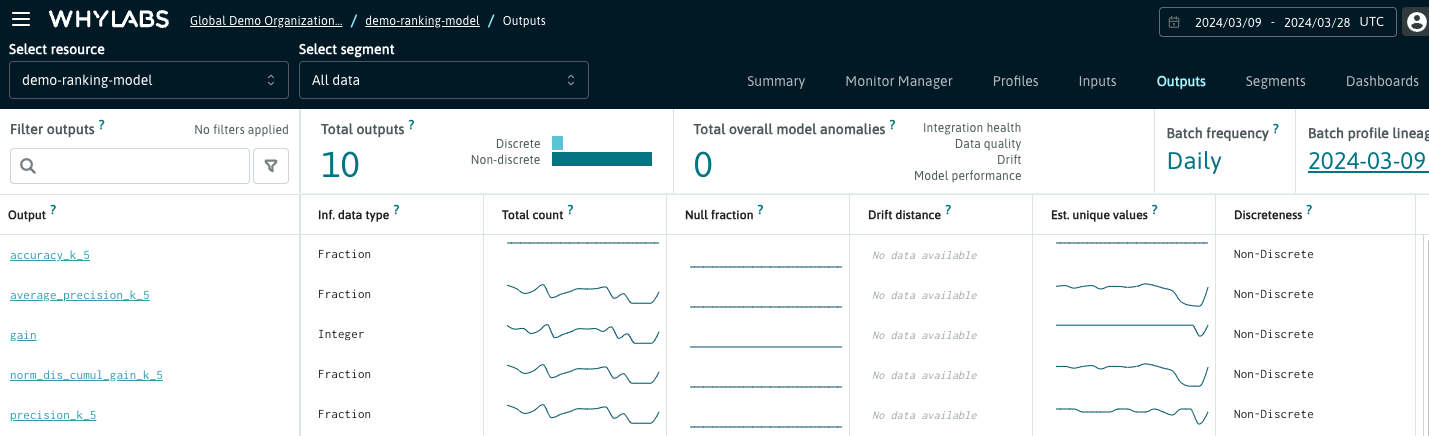
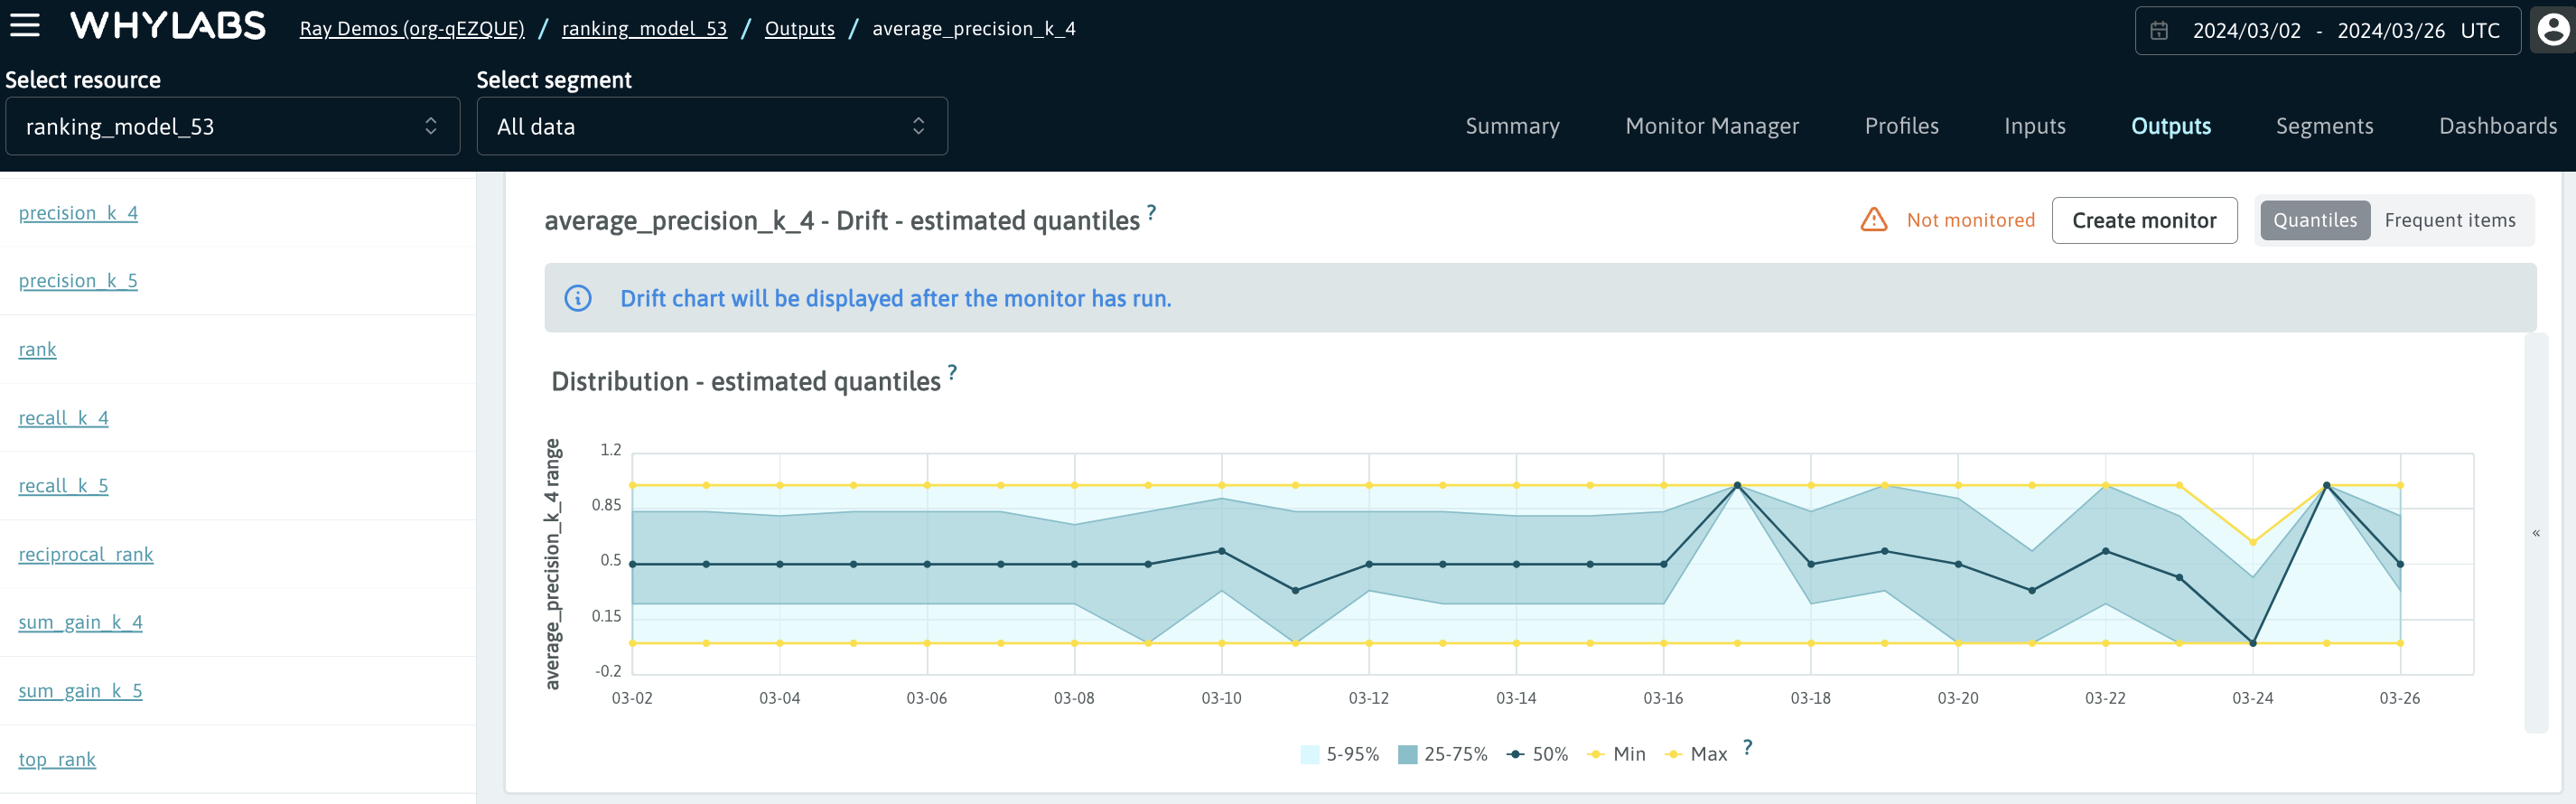
Outputs Dashboard displays all the statistical properties of the ranking metrics including the data distribution histogram.
Performance Dashboard shows the mean of each performance metric, so that the most important signals are displayed on the same page. It is possible to customize this dashboard by choosing another available attribute such as median or 99th percentile instead of the mean - please check the guide on custom performance metrics to learn how to perform this customization.
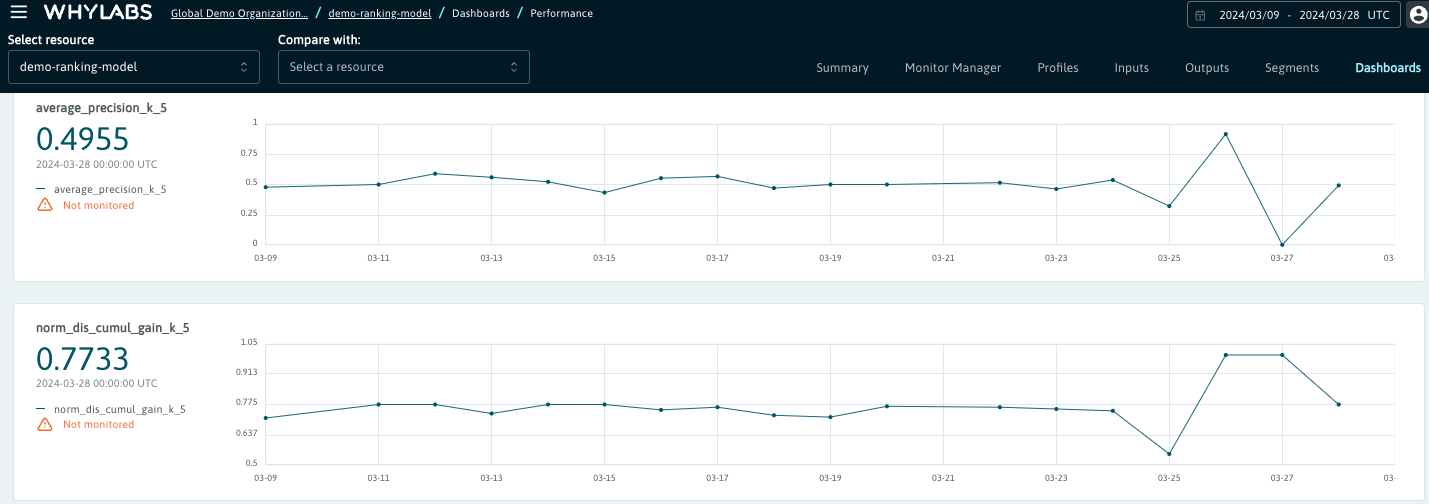
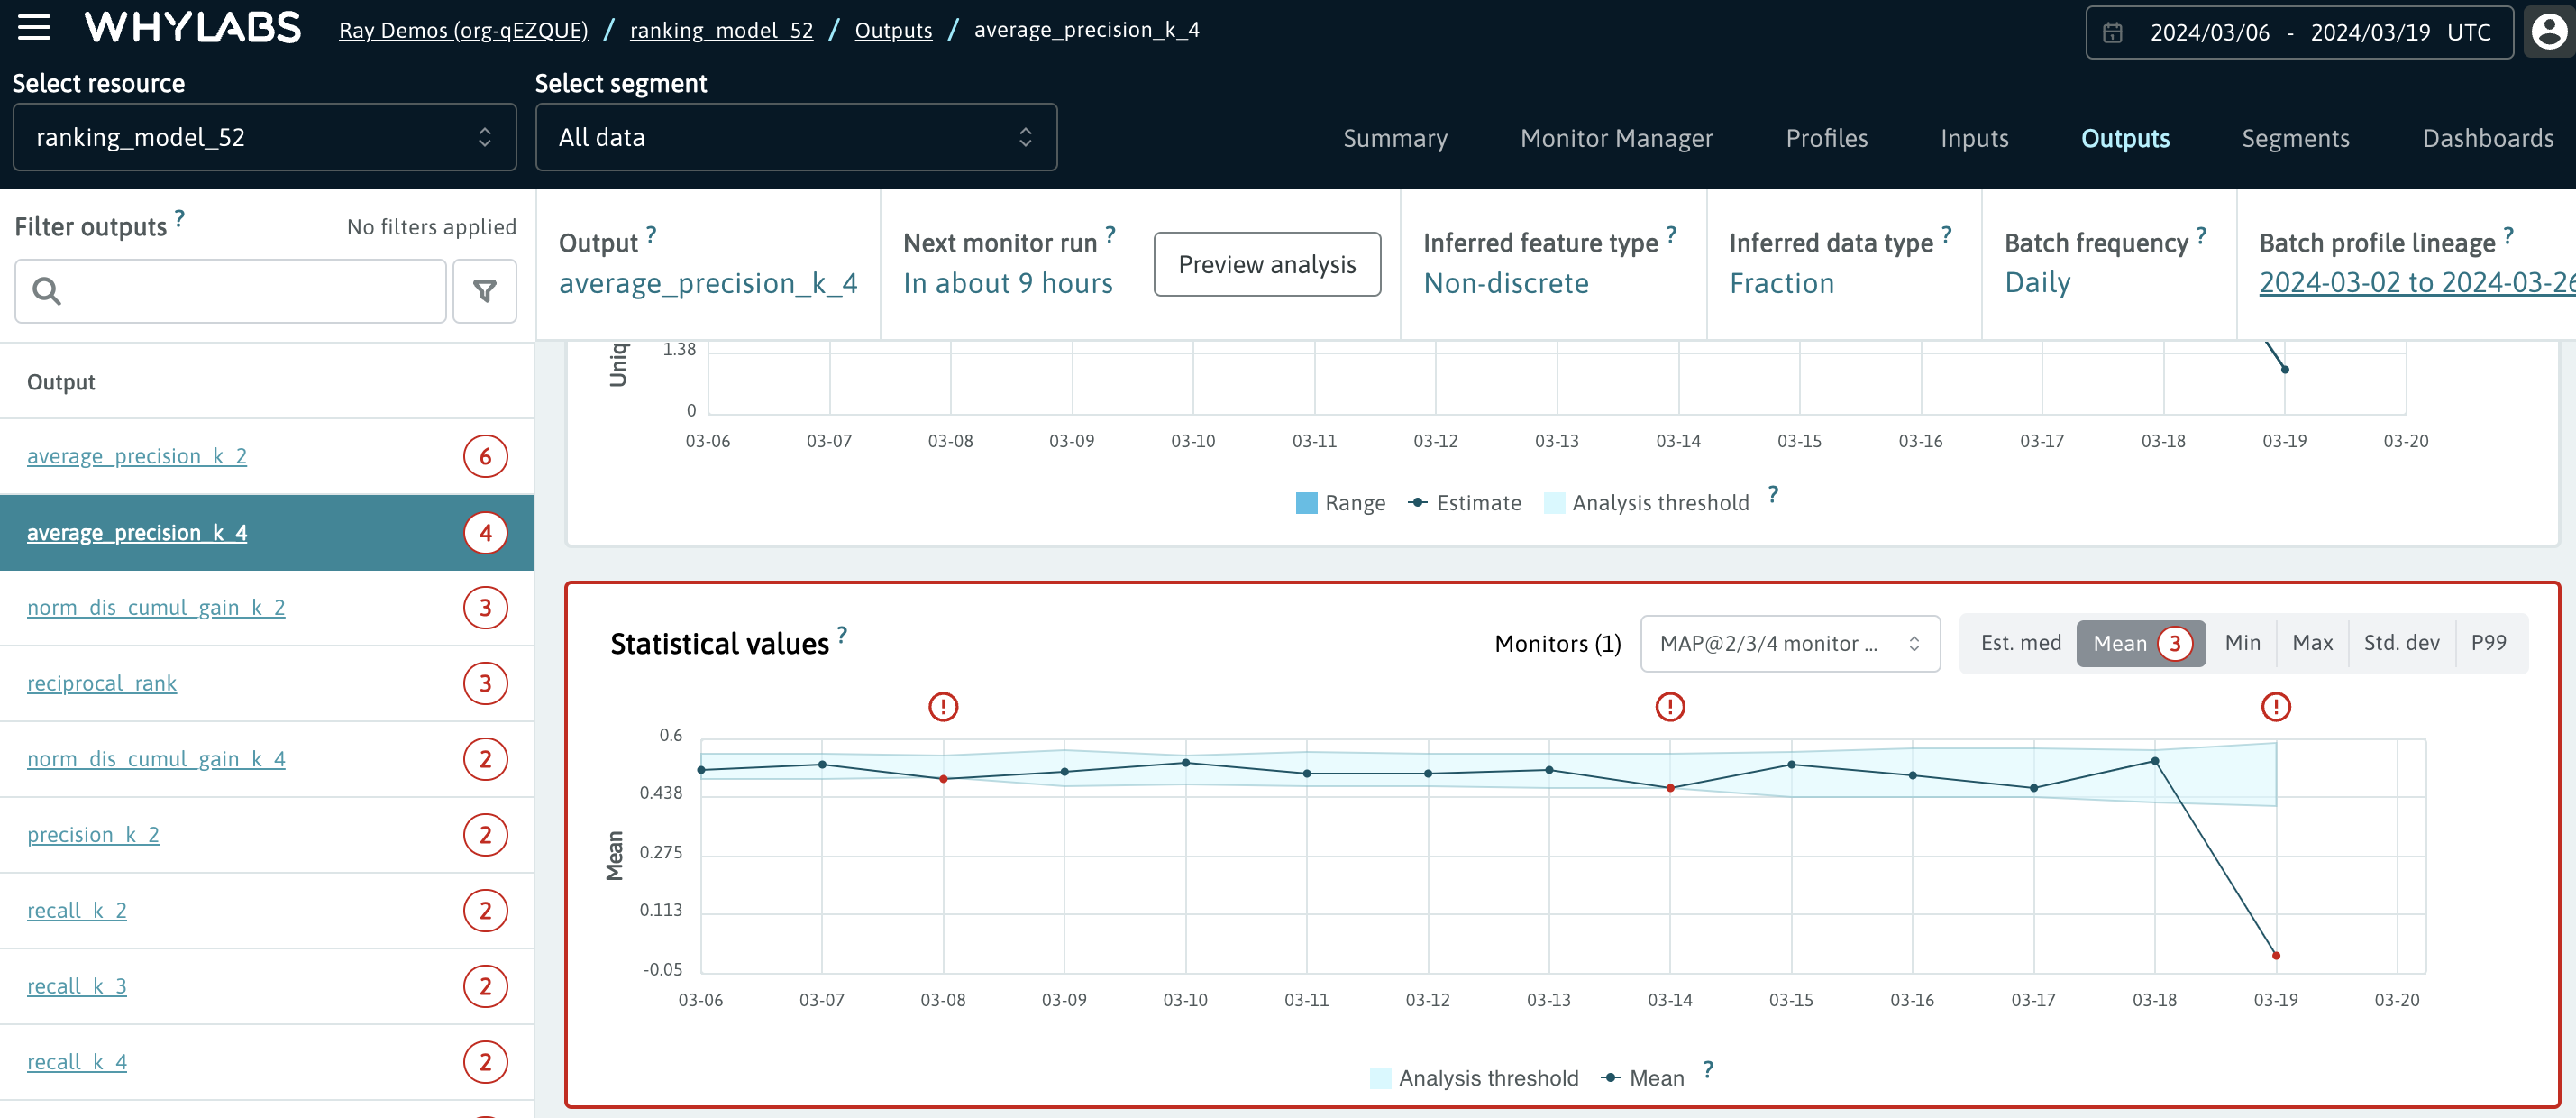
All signals pertaining to ranking metrics can be monitored. In case the monitors are applied to the metrics that are visible in the Performance Dashboard, the alerts will show up both on the Outputs page and in the Performance Dashboard.
In the screenshot below we can see an example monitor applied to the Mean Average Precision at k=4.
WhyLabs can compute ranking metrics with both single and multiple targets. Here is an example for logging ranking metrics for a task with multiple targets:
import pandas as pd
from whylogs.experimental.api.logger import log_batch_ranking_metrics

non_numerical_df = pd.DataFrame(
    {"raw_predictions": [
            ["cat", "pig", "elephant"],
            ["horse", "donkey", "robin"],
            ["cow", "pig", "giraffe"],
            ["pig", "dolphin", "elephant"]],
        "raw_targets": [
            ["cat", "elephant"],
            ["dog"],
            ["pig", "cow"],
            ["cat", "dolphin"]]})

results = log_batch_ranking_metrics(
    k=3,
    data=non_numerical_df,
    prediction_column="raw_predictions",
    target_column="raw_targets",
    convert_non_numeric=True)
For more information on ranking metrics and how to use them, please refer to this notebook.
Custom Performance Metrics
If the default performance metrics such as accuracy, are not sufficient for your project's needs, you can add your own metrics and designate them as Custom Performance Metrics. This allows you to use features such as Segment Analysis and Performance Comparison with metrics that are more relevant to your use case.
To track a column as a Custom Performance Metric, you can use the PutEntitySchemaMetric API. Once set, the custom performance metric will be listed alongside other performance metrics until removed via API.
Here's a sample request for the API that sets the mean value of a column named my_custom_metric as a Custom Performance Metric:
{
  "label": "my_custom_metric.mean",
  "column": "my_custom_metric",
  "defaultMetric": "mean"
}
For a list of available metrics, check out this page.
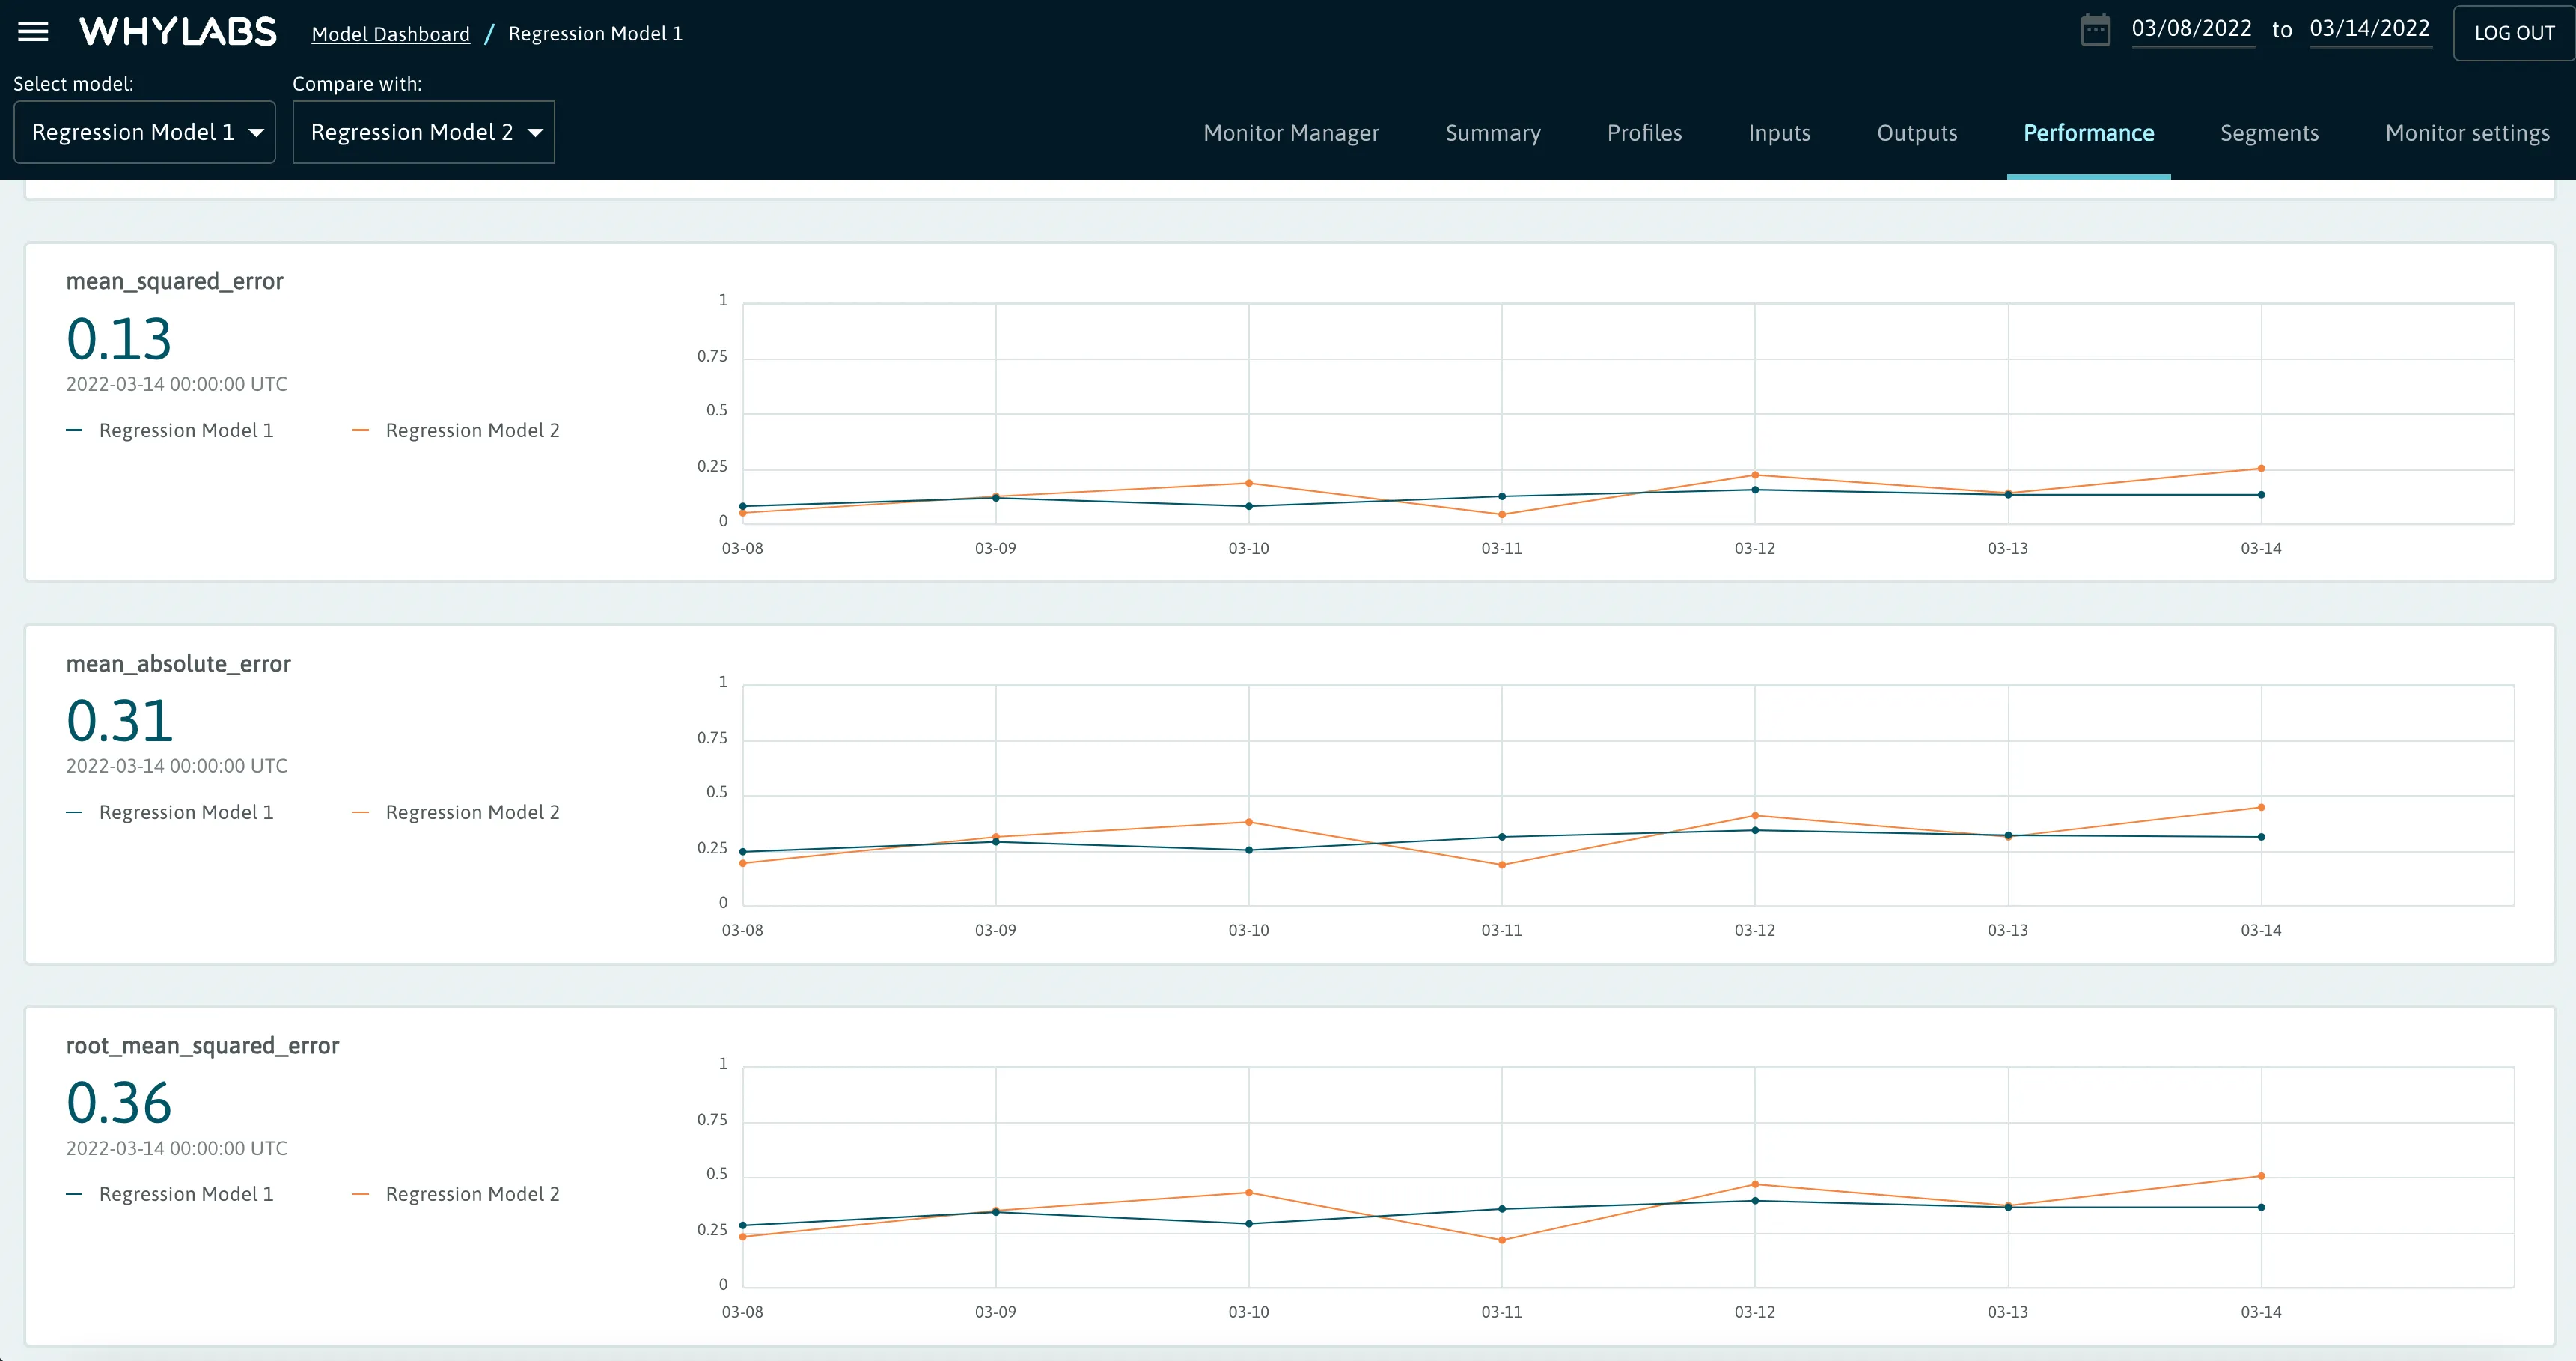
Performance Comparison
WhyLabs allows users to compare the performance of two models side by side. Users can select two models of the same type (classification or regression) in the upper left dropdowns. WhyLabs will display plots of performance metrics from each model.
This makes it a simple matter to determine the superior model when comparing multiple versions of a model.
Tips and Best Practices
There are a few tips and best practices as reminders for those using performance metrics:
- Raw data is not sent to the WhyLabs platform, confusion matrix or error bounds are calculated during the profiling process.
- Ground truth data can be partial and/or delayed. Be sure to log with the dataset timestamp that matches that of the logged input and output data -- often the date of query or prediction.
- Remember to remove nulls, Nones, NaNs before logging performance data.
- For ROC curves to be calculated correctly, you must log the positive label for the task, not each individual prediction. This is commonly misunderstood, even for other packages such as scikit-learn.
- Score can be any threshold used for classification: probability, confidence, distance to decision boundary, others. The score does not have to be limited to a particular interval.

