Onboarding to the WhyLabs AI Control Center
Overview
With our self-serve option, users can start getting value out of WhyLabs right away for free. Users can onboard their first resource with the following steps:
- Sign up for a WhyLabs account and create your first resource for free! For users ready to take advantage of the full functionality of WhyLabs without ever having to go through sales, subscriptions can be purchased via the AWS Marketplace. Alternatively, if your account becomes over limits, follow the "Upgrade plan" prompts to purchase the Expert plan using a credit card.
- Install the whylogs library, which generates statistical profiles of any dataset on the client’s side.
- Inject whylogs into your data pipeline to deliver dataset profiles to the WhyLabs resource you just created in the WhyLabs platform. Our whylogs library is interoperable with any ML/Data infrastructure and framework. See more about our integrations here.
- Customize monitors to your needs, investigate anomalies and set up automatic notifications to stay on top of data/model health.
The following example walks through a simple Python integration using a tabular dataset. However, this exercise is also possible using any one of our integrations. As an example, see our Spark integration to begin profiling datasets using Spark instead of general Python.
Getting Started in WhyLabs
Once you sign up for an account, you'll be redirected to the Get Started page:
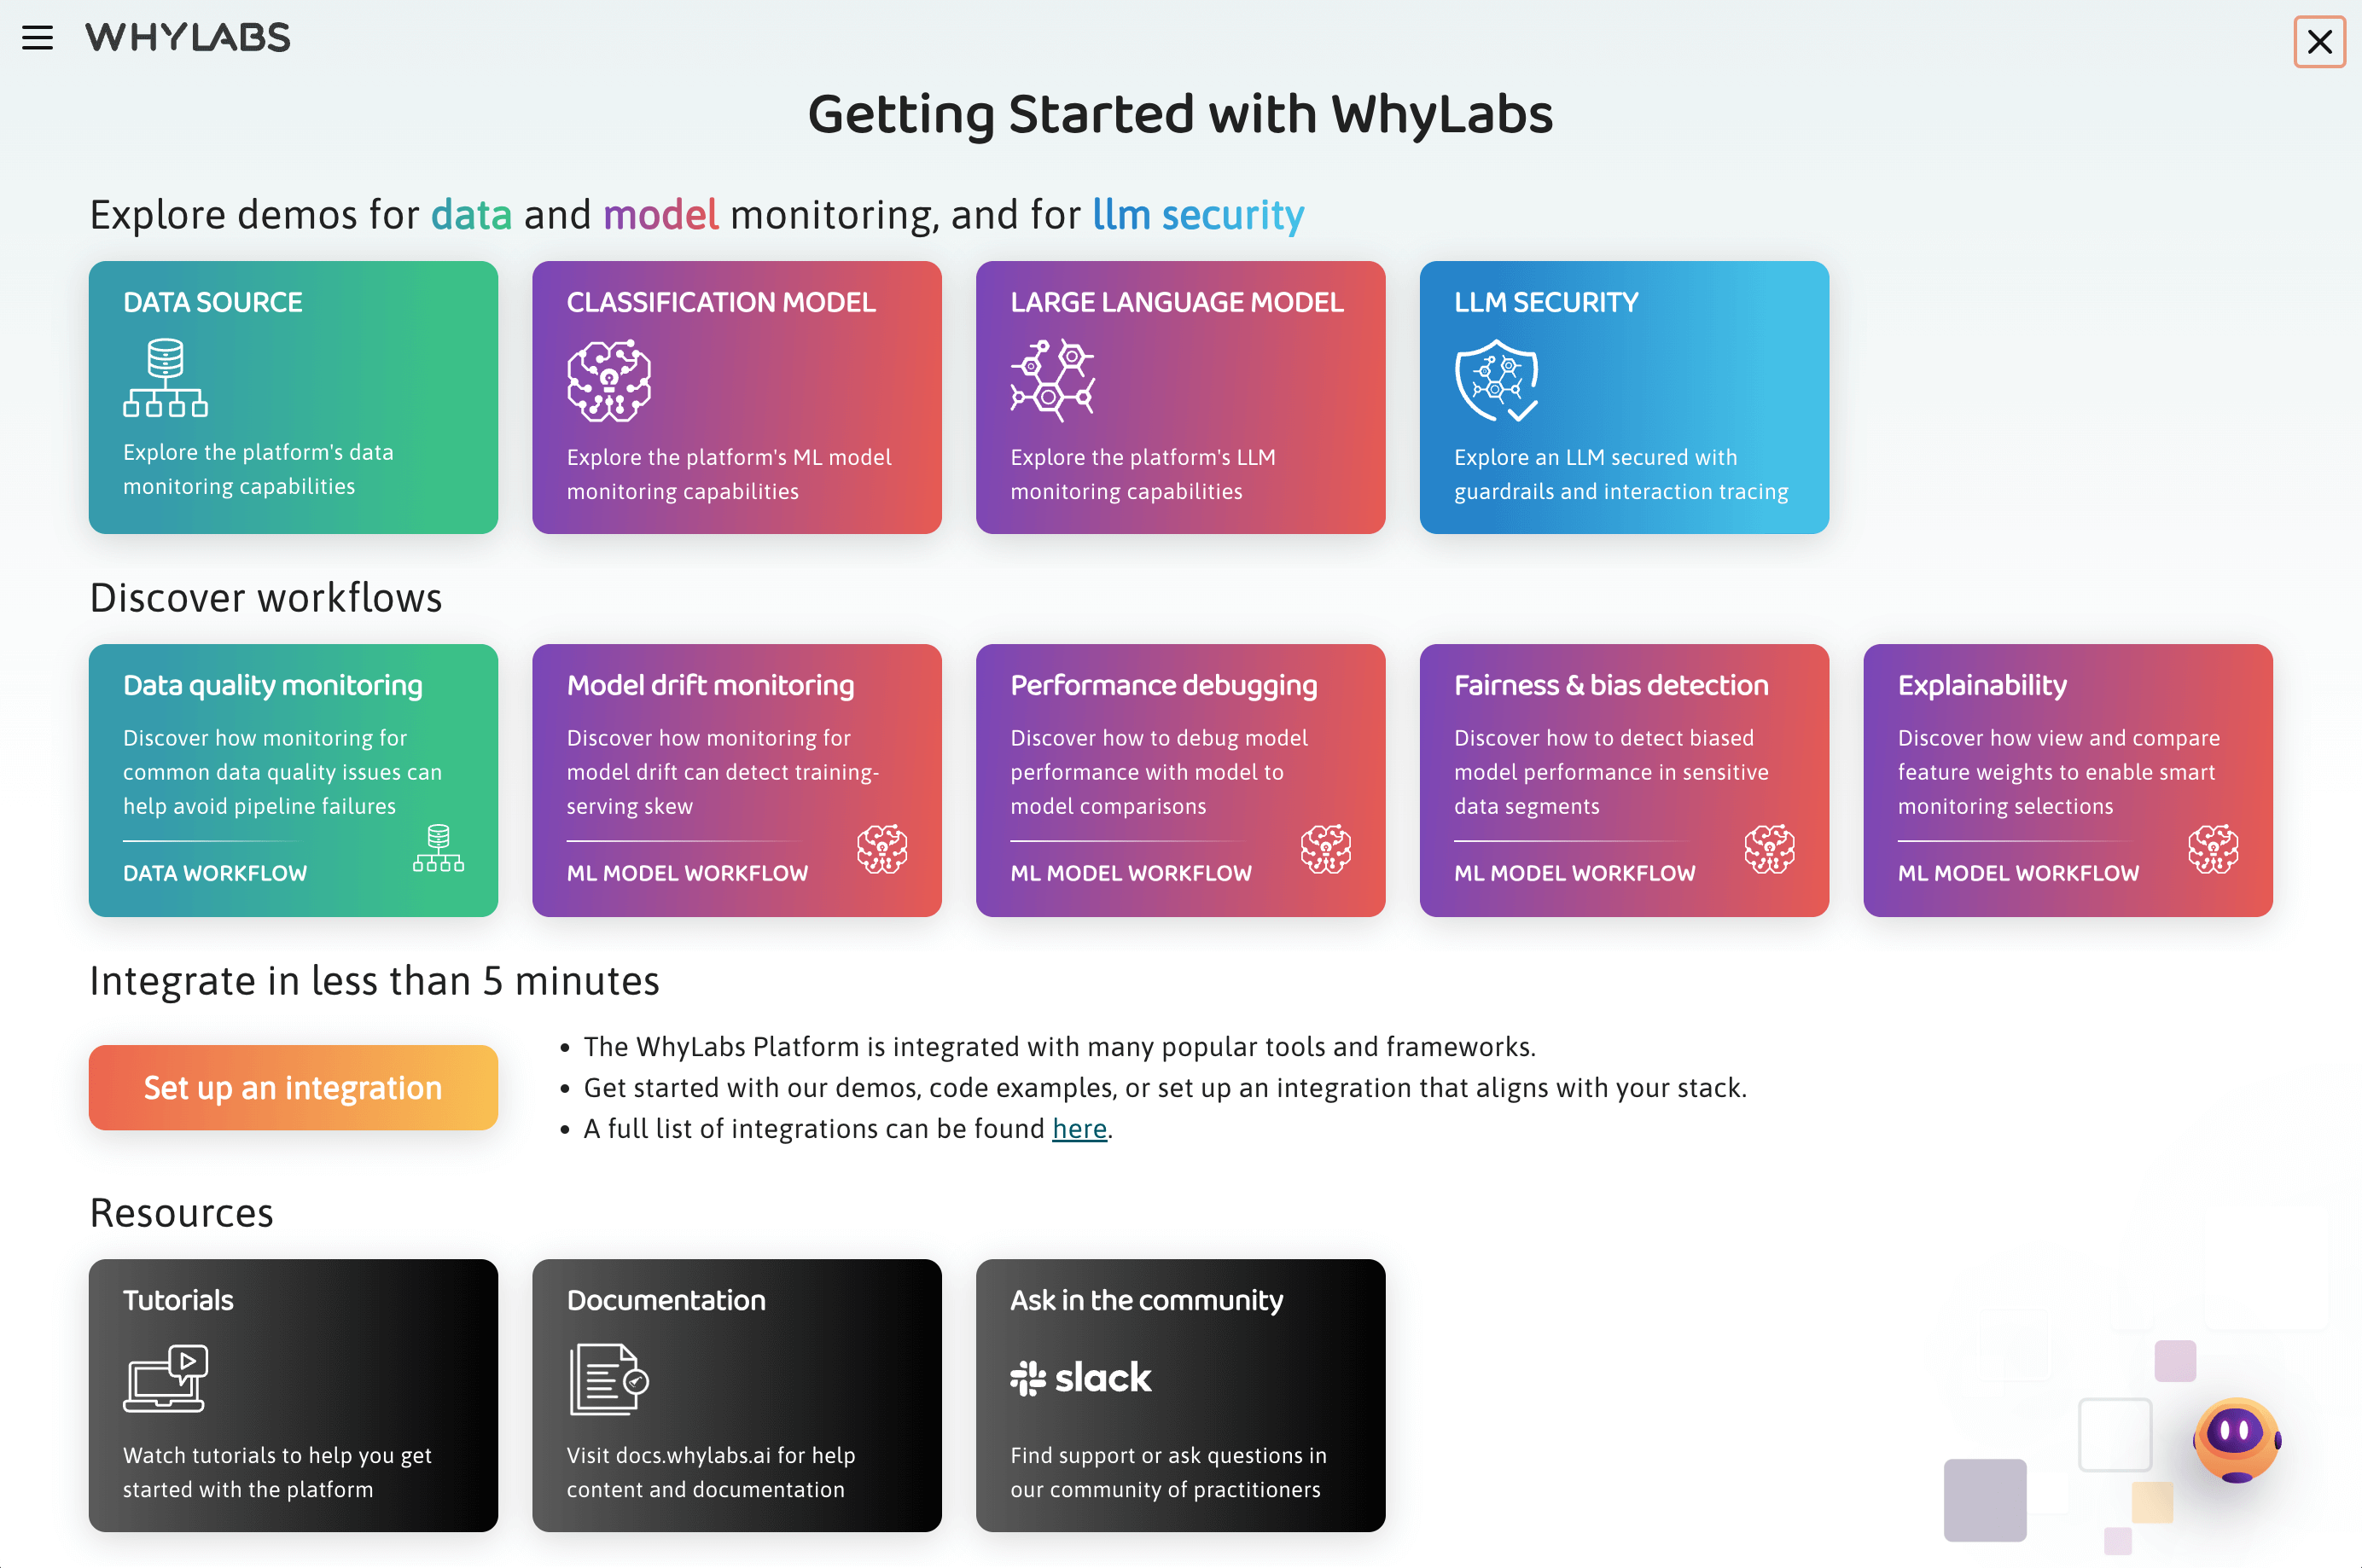
From here you can explore our Demo Organization with many different resources to help you get started.
For example, you can select the Model drift monitoring demo workflow to see how to set up a model resource and start monitoring it for drift:
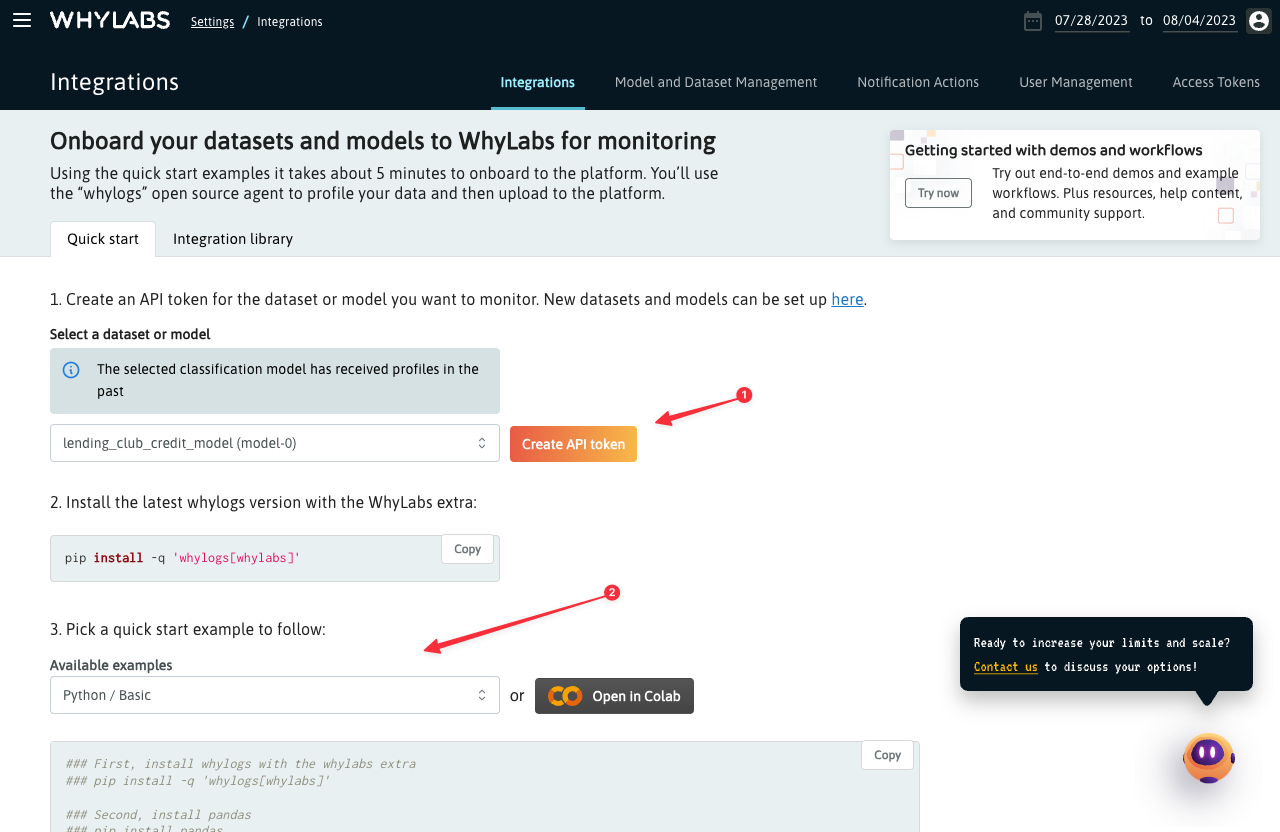
You can also use the Set up an integration button to go to the Integrations page where you can easily generate an API token and pick an example to get started:
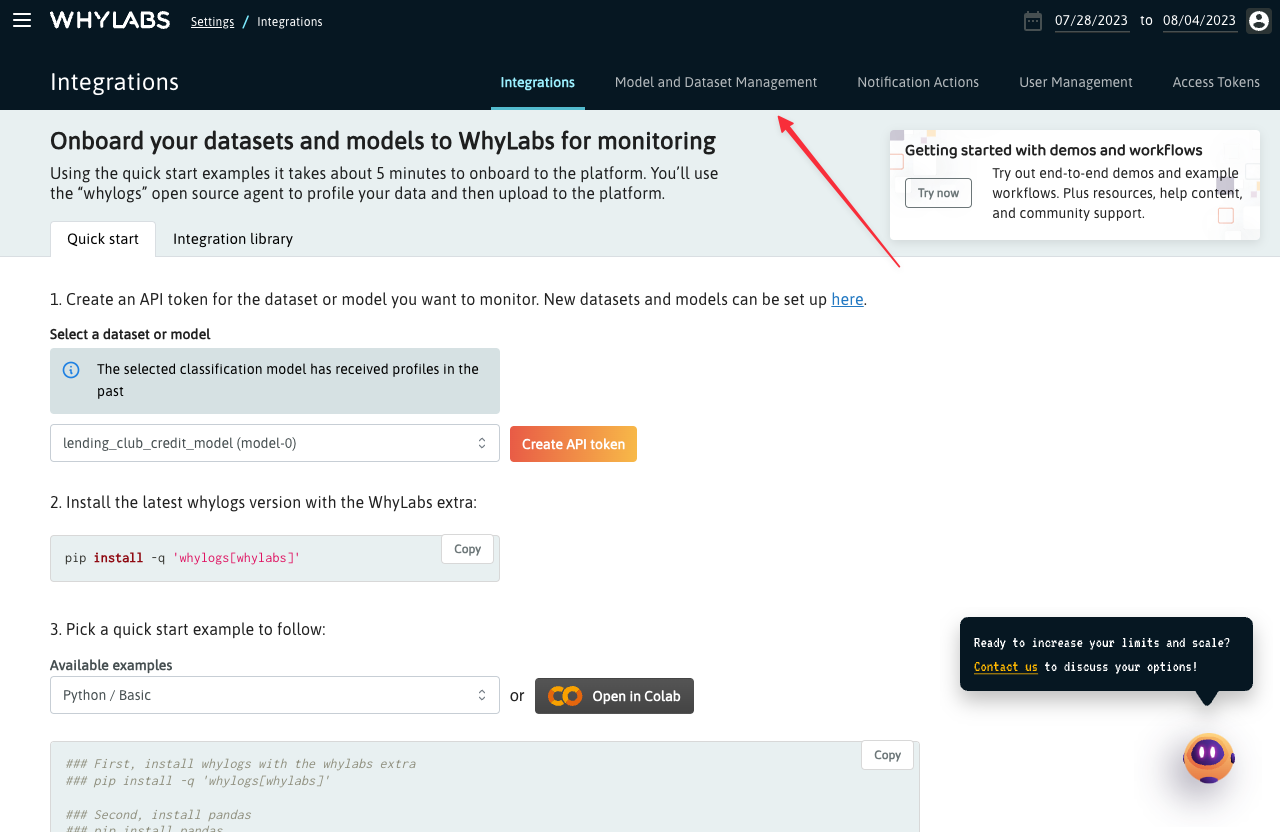
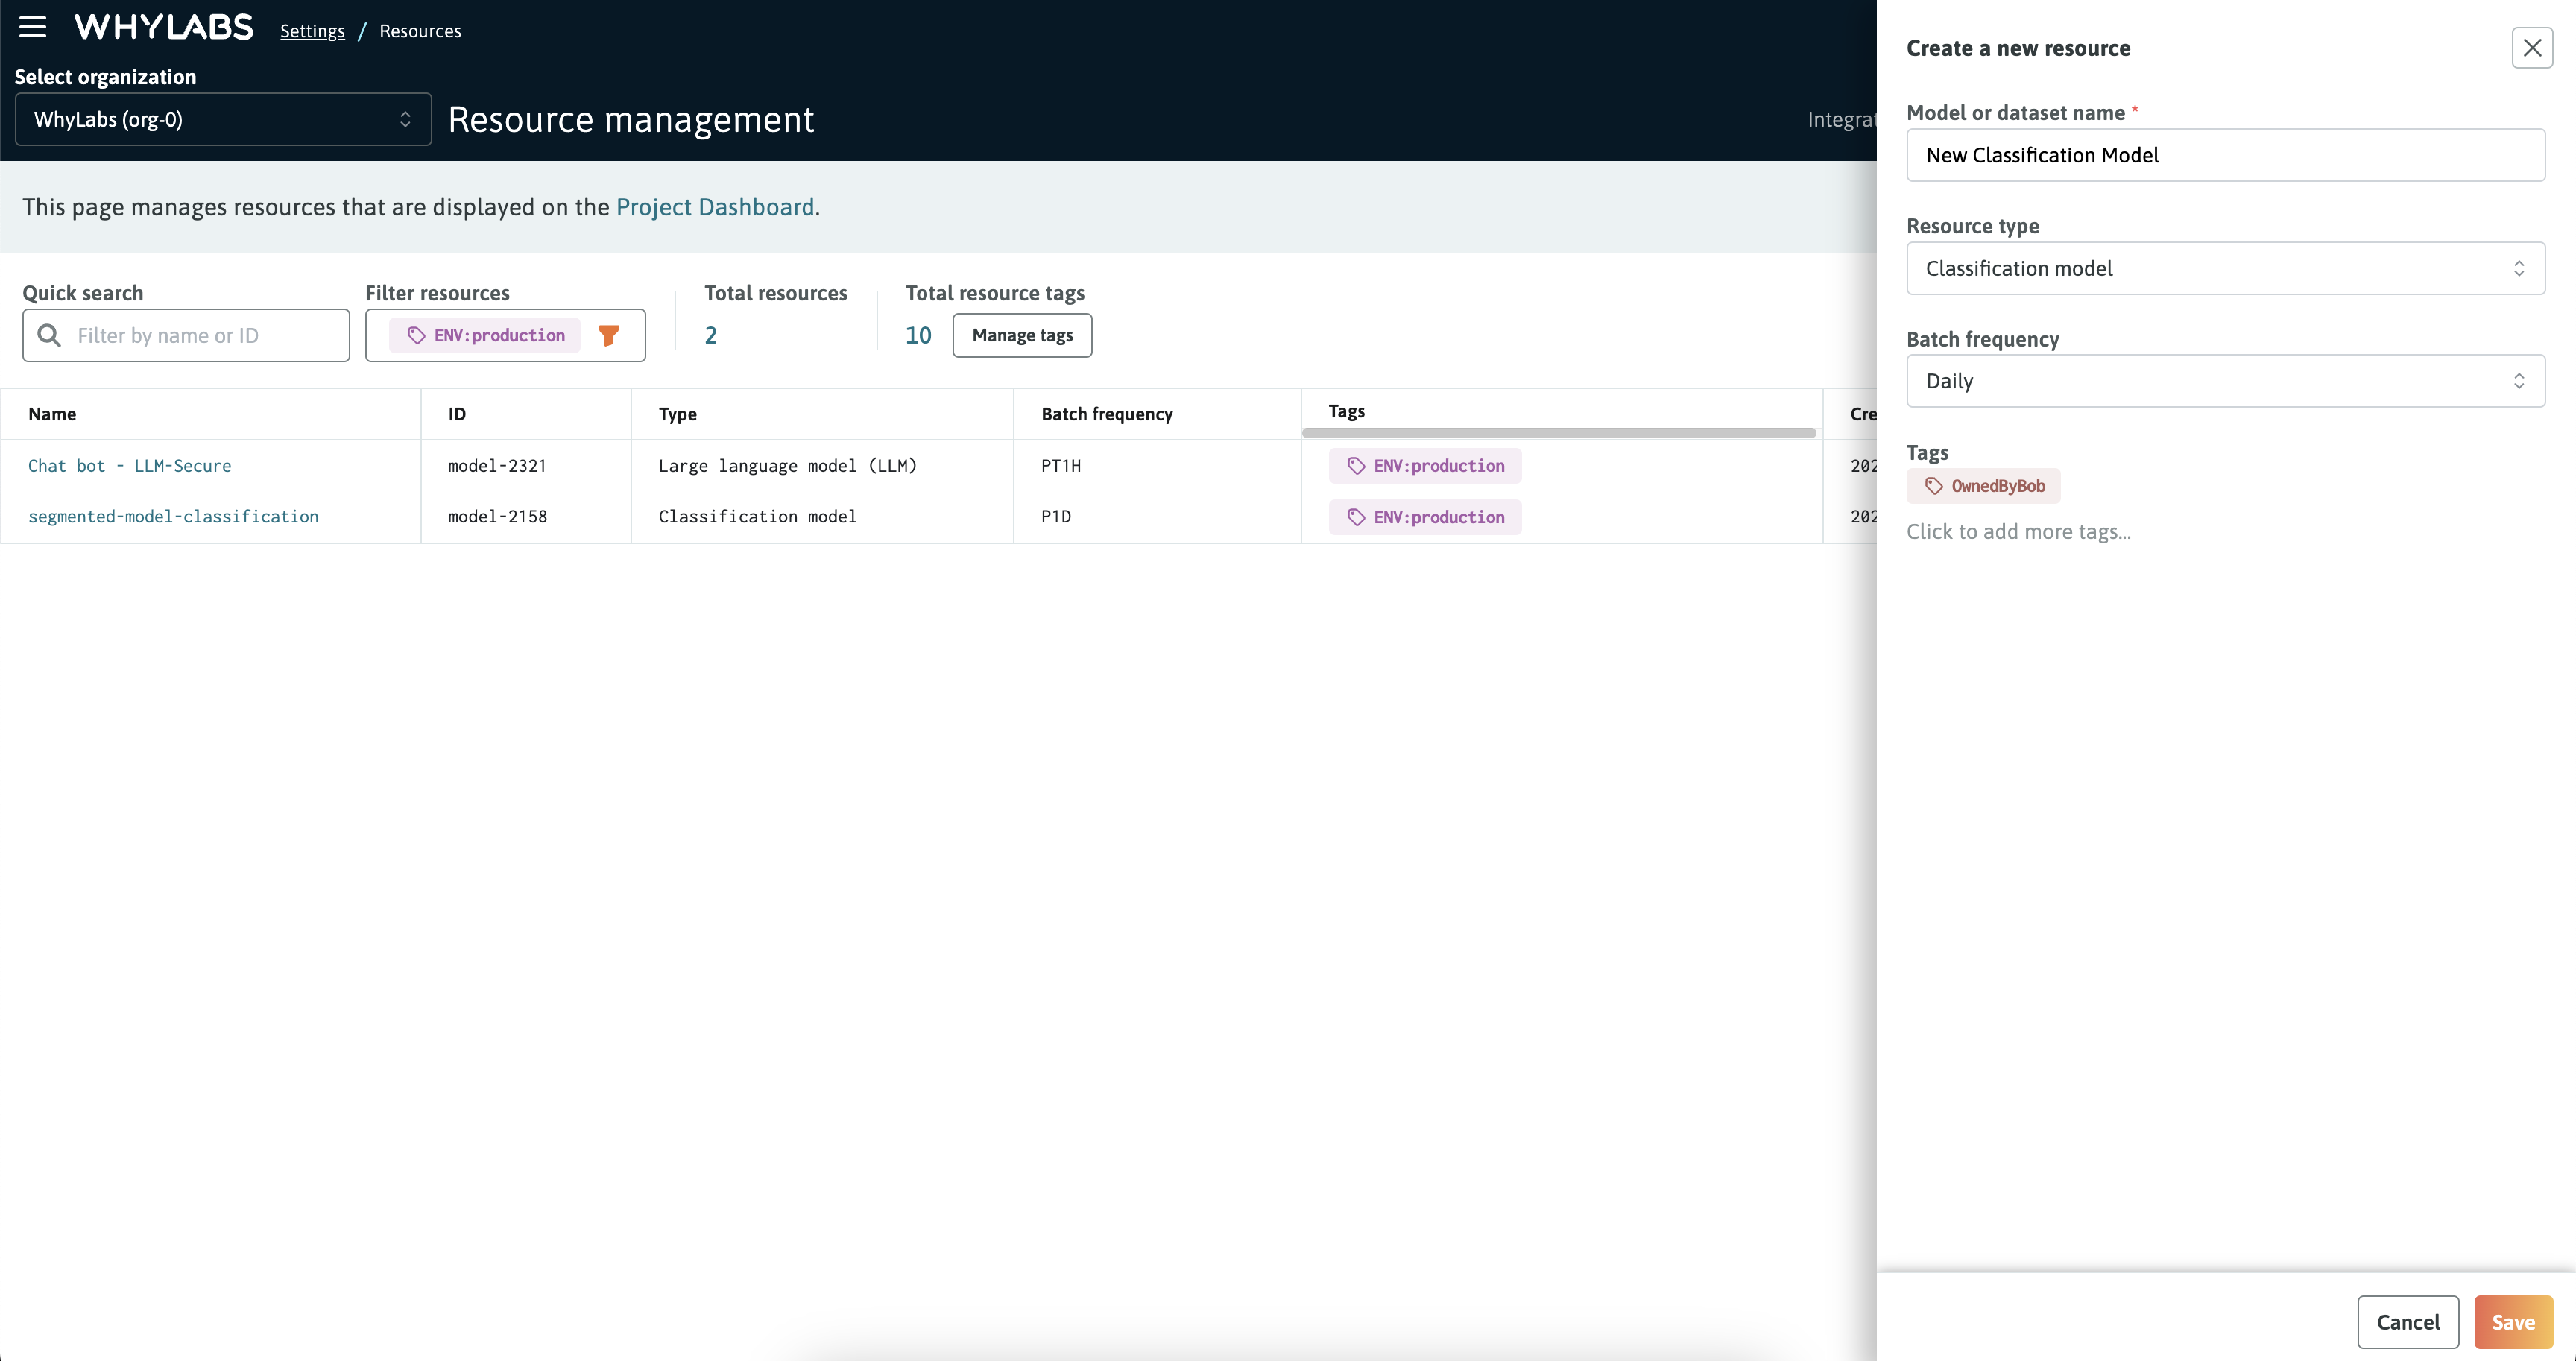
To create a new resource from the Integrations page, click on the "Model and Dataset Management" tab:
A resource is any ML model (including LLMs), data pipeline, data stream, or dataset that you want to monitor in WhyLabs. Profiles generated by whylogs can be regularly uploaded to a particular WhyLabs resource for ongoing monitoring. More information on profiles can be found here.
A model resource is optimized for monitoring model inputs, outputs, and performance. A dataset resource has many of the same characteristics, but excludes performance monitoring and does not categorize dataset features as inputs or outputs. For this example, we will create a model resource.
From the Model and Dataset Management page, simply provide a name for your resource and select a type for it. The type of a resource will determine which performance metrics will be displayed like in the Model Performance tab. The type can be updated later if it's left blank when setting up the resource.
Populating the WhyLabs Resource with data
There are numerous ways to set up an integration with the WhyLabs platform. In this guide we'll go over a basic example using the open-source Python package - whylogs.
First, to authenticate with the platform and connect to a specific WhyLabs resource, you will need the following:
- A WhyLabs API Key
- The organization ID in which the target resource lives
- The target dataset/model ID
Below you can find instructions on how to generate or locate the required information.
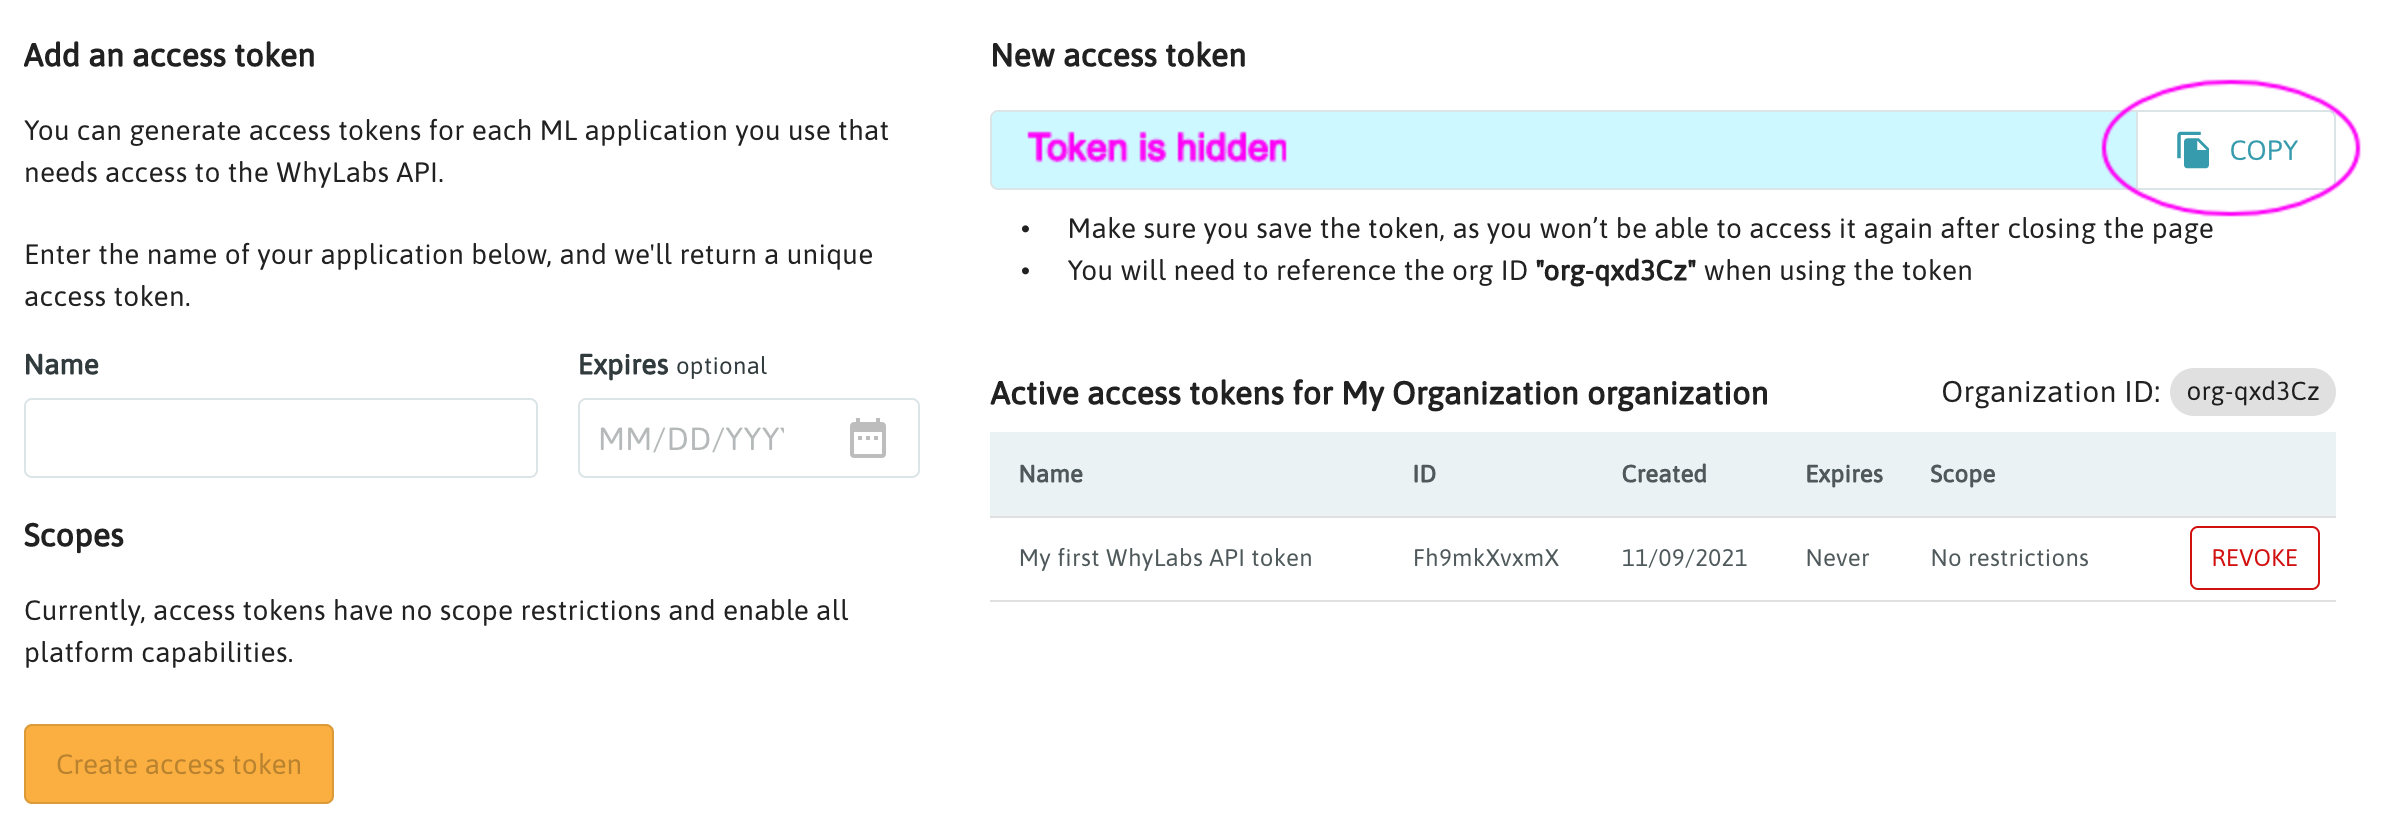
Access token (API key) generation
You can create a new API token from the Access Tokens page in the "Settings" section of the platform. The token will be displayed only while the page is loaded. Alternatively, you can use a previously created access token that you have already saved to your local environment.
Resource ID for either a dataset or model resource
The dataset or model ID for each resource is available from the Project Dashboard (shown below), as well as on the Resource Details card on the resource's Summary page. It's also shown on the Model and Dataset Management page, which is accessed from the WhyLabs Settings page.
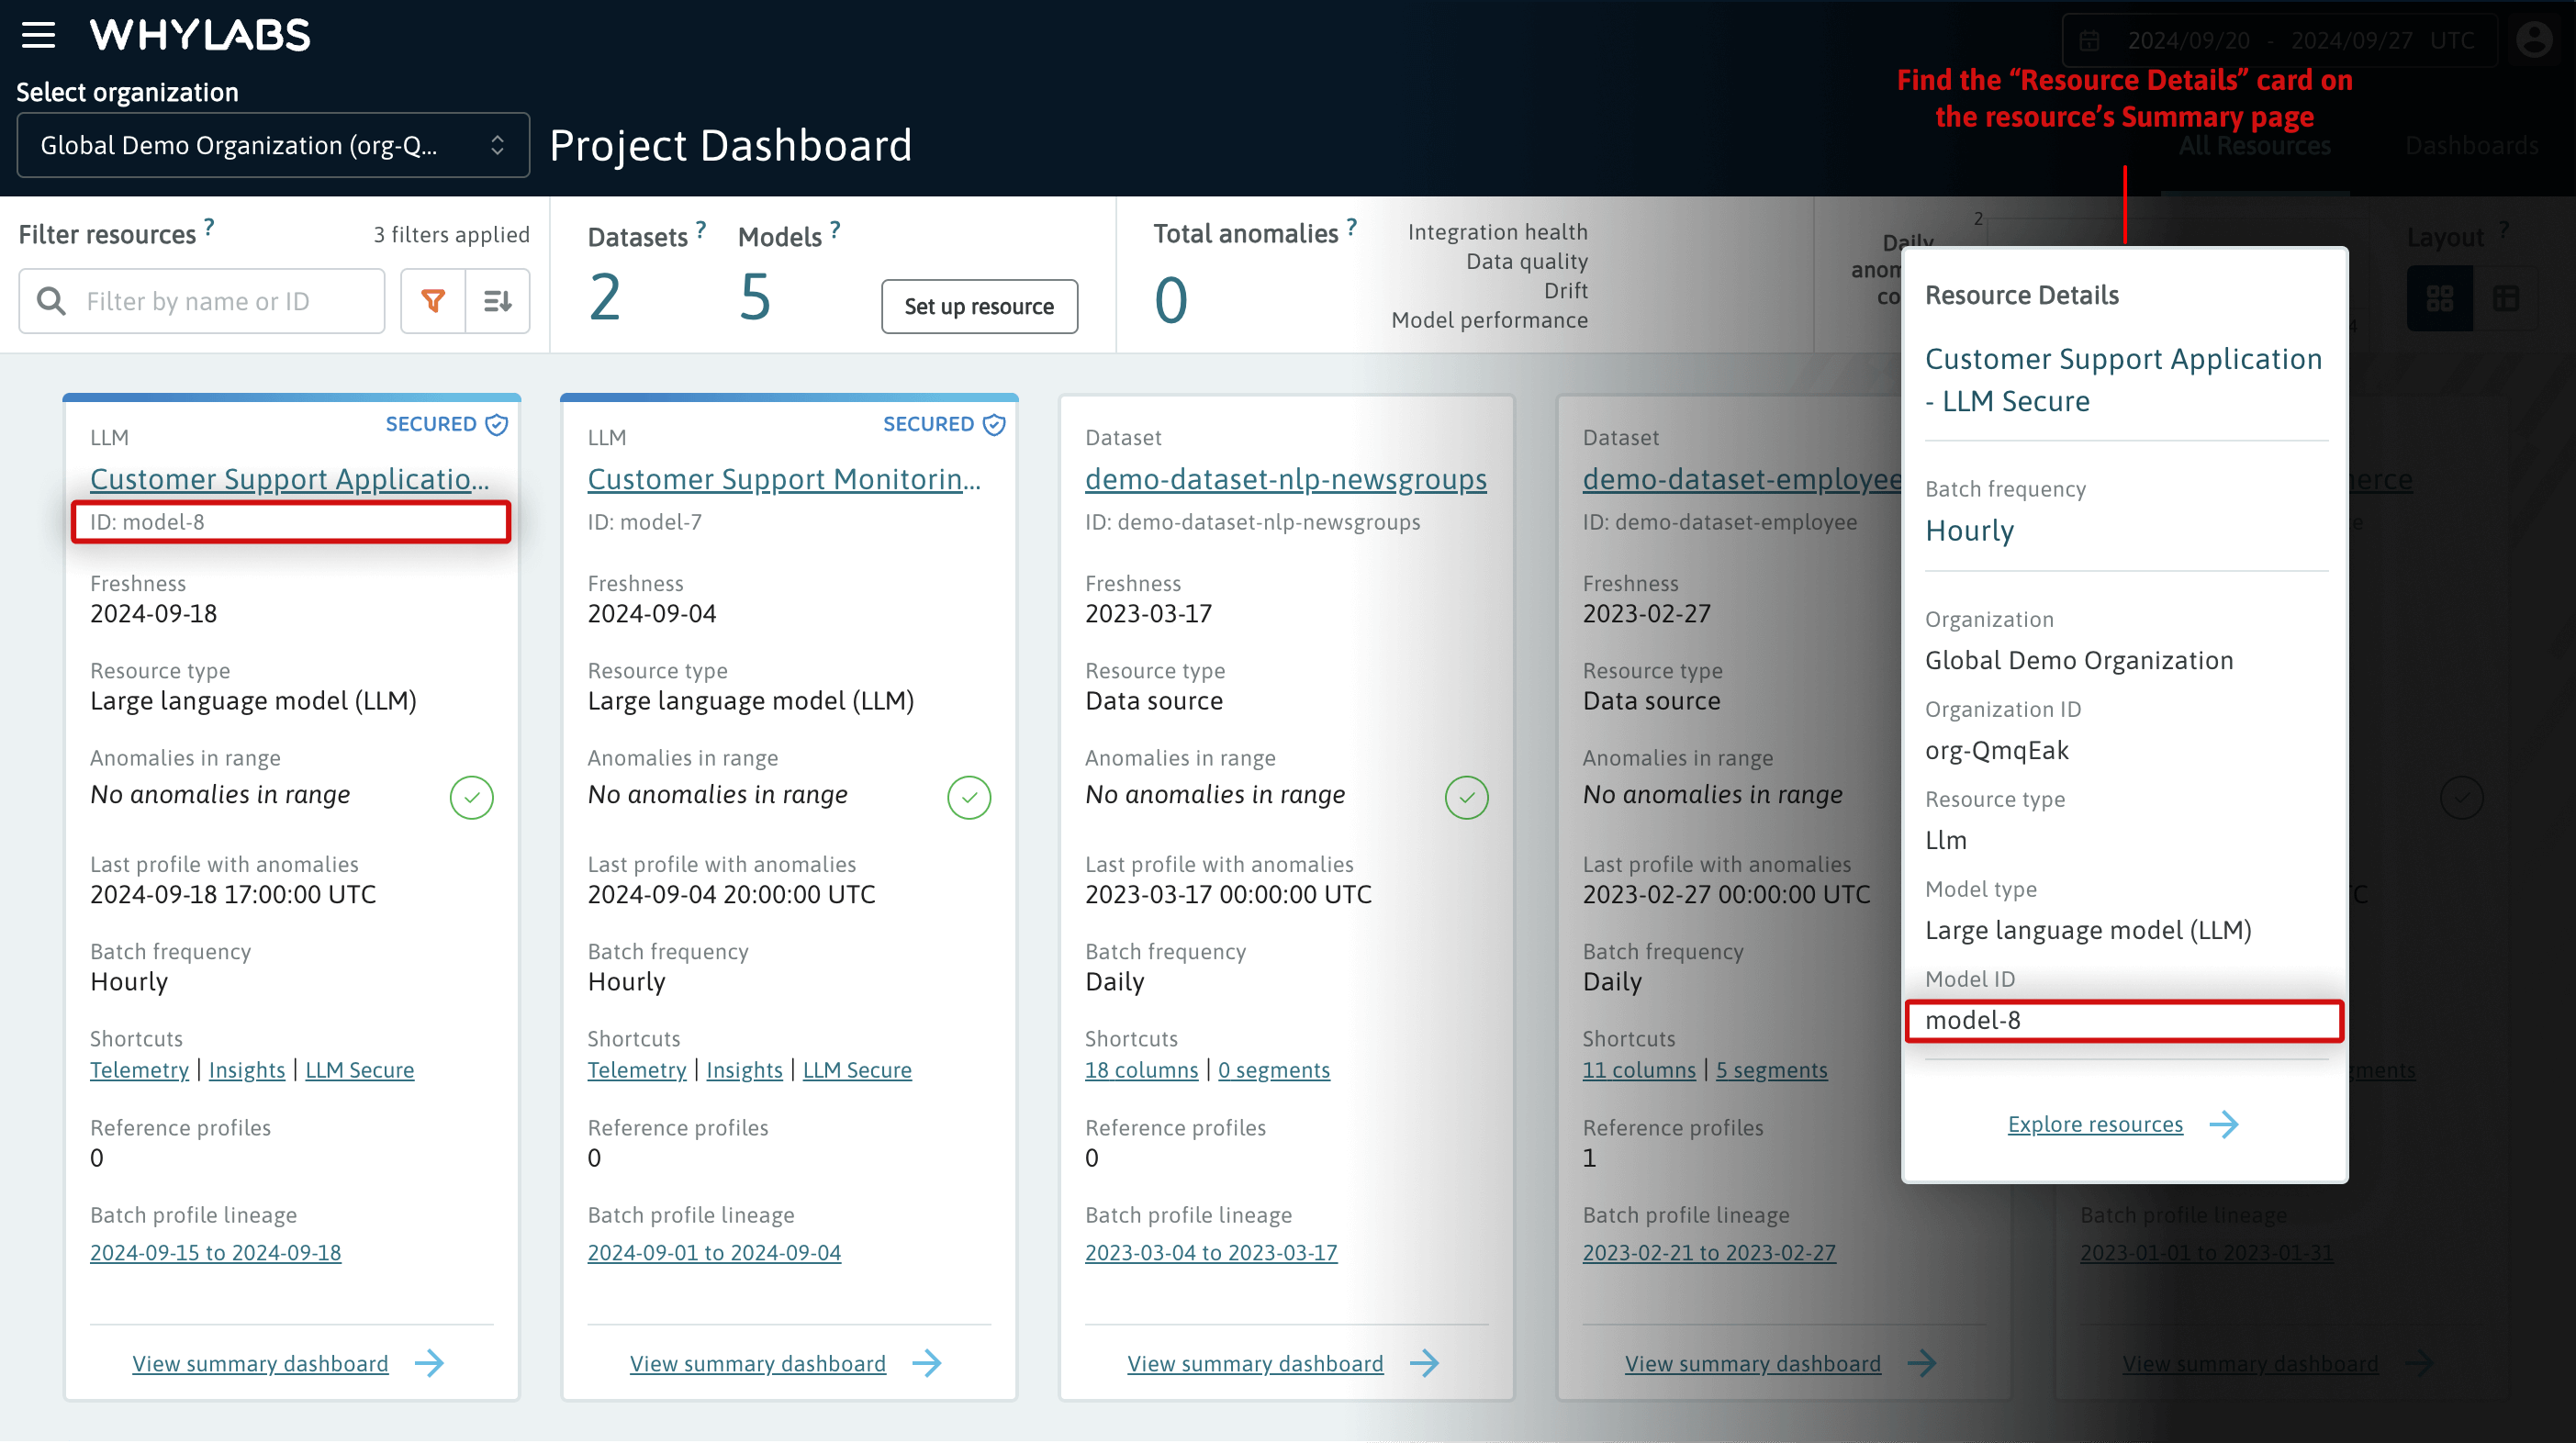 The resource ID can be found on the Project Dashboard and the Resource Details card on the resource's Summary page.
Installing the whylogs library
The whylogs logging agent is the easiest way to enable logging, testing, and monitoring in an ML/AI application. The lightweight agent profiles data in real-time, collecting thousands of metrics from structured data, unstructured data, and ML model predictions with zero configuration.
Install the whylogs library along with the module containing the WhyLabs writer. The WhyLabs writer will be used for uploading profiles to the WhyLabs platform.
pip install -q 'whylogs[whylabs]'
Uploading a profile
Once you have an API key and the resource ID needed for authentication, and whylogs installed in your environment, you can run the following Python example to upload a profile. Note that the WHYLABS_DEFAULT_DATASET_ID parameter is used regardless of the resource type, either a model or dataset ID.
import os
import whylogs as why
import pandas as pd
from whylogs.api.writer.whylabs import WhyLabsWriter

os.environ["WHYLABS_API_KEY"] = "YOUR-API-KEY" # This should have the format XXXXXXXXXXX:org-id
os.environ["WHYLABS_DEFAULT_DATASET_ID"] = "YOUR-DATASET-ID" # By default, this should have the format model-xxx or dataset-xxx

df = pd.read_csv("https://whylabs-public.s3.us-west-2.amazonaws.com/datasets/tour/current.csv")

result = why.log(df)

writer = WhyLabsWriter()
writer.write(result)
After running this code, users will see a single datapoint appear under the relevant WhyLabs resource. The image below shows the “inputs” view as an example.
The real value of WhyLabs is gained from uploading multiple profiles over a span of time, after which point WhyLabs can apply out-of-the-box anomaly detection and automatically send alerts to users about their data and model health!
Tracking Data Profiles Over Time
By Default, an uploaded profile will be associated with the current date at the time of upload. If a user uploaded two profiles for two different batches of a dataset consecutively, then these two profiles will be merged together as a single aggregated profile for the day of upload.
This property of aggregating profiles is called mergability and provides great flexibility when integrating whylogs with data pipelines or setting reference profiles. For example, in a distributed data pipeline, profiles of partial datasets can be published from different nodes and will be automatically merged within WhyLabs for a holistic view of the entire dataset.
*For models with an hourly batch frequency, all of the above applied at the hourly level
In lieu of the above, any particular batch of data should only have their profiles published once, though batches of data may have their profiles published throughout the day after which point profiles will be merged into a single profile at the day level (or hourly level for models with hourly batch frequency).
In order to get started with tracking a dataset over time, there are a few options. The first is to continue uploading profiles over a period of multiple days by integrating whylogs with your current pipeline (see integrations here). Another option is to perform backfilling.
When uploading a profile to WhyLabs, users have the option to include a dataset_timestamp parameter associated with the uploaded profile. For example, modifying the previous code example with the following will associate the uploaded profile with a date of February 7th, 2022:
import datetime

#log a dataframe and extract its profile
profile = why.log(df).profile()

#set the dataset timestamp for the profile
profile.set_dataset_timestamp(datetime.datetime(2022,2,7,0,0))

#write the profile to the WhyLabs platform
writer.write(profile=profile.view())
Users can readily backfill profiles and visualize them in the UI right away. Note that backfilling wide datasets with thousands of columns may take additional processing time to populate. Read more about backfilling here.
Users are encouraged to experiment with WhyLabs by artificially manipulating a test dataset by injecting anomalies, warping data distributions, etc. over a backfilled time to see immediate results of WhyLabs monitoring abilities.
Monitoring and Alerting
WhyLabs monitors a variety of dataset properties at the feature level including distribution distance (how similar is a current features distribution from historical ones), count/ratio of missing values, count/ratio of unique values, and inferred data types.
Users have the ability to customize monitor thresholds and have a variety of options for defining a baseline to compare against (trailing window, static reference profile, specific date range). See more about monitoring here.
Users can configure automatic actions to be taken upon the detection of an anomaly such as notifications via Slack, Pager Duty, email, etc. See more about alerts and notifications here.
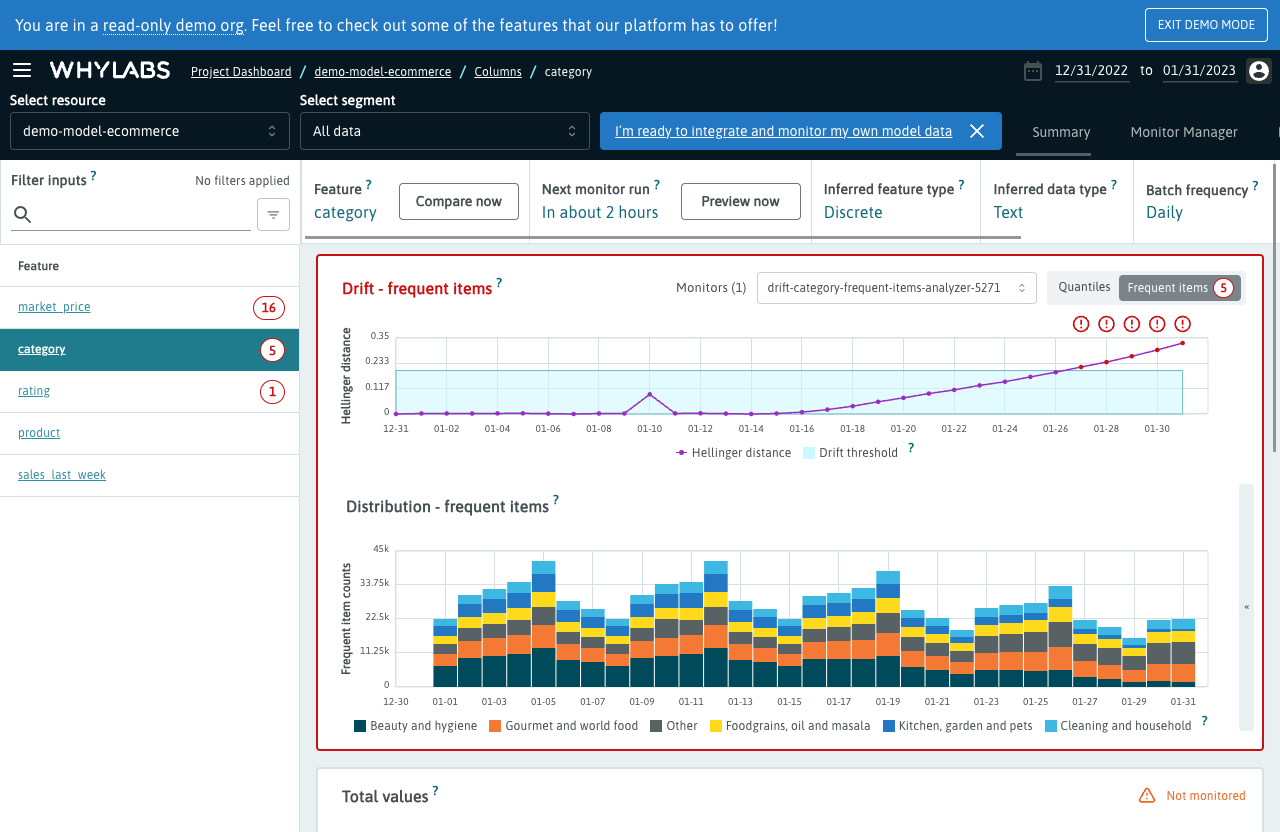
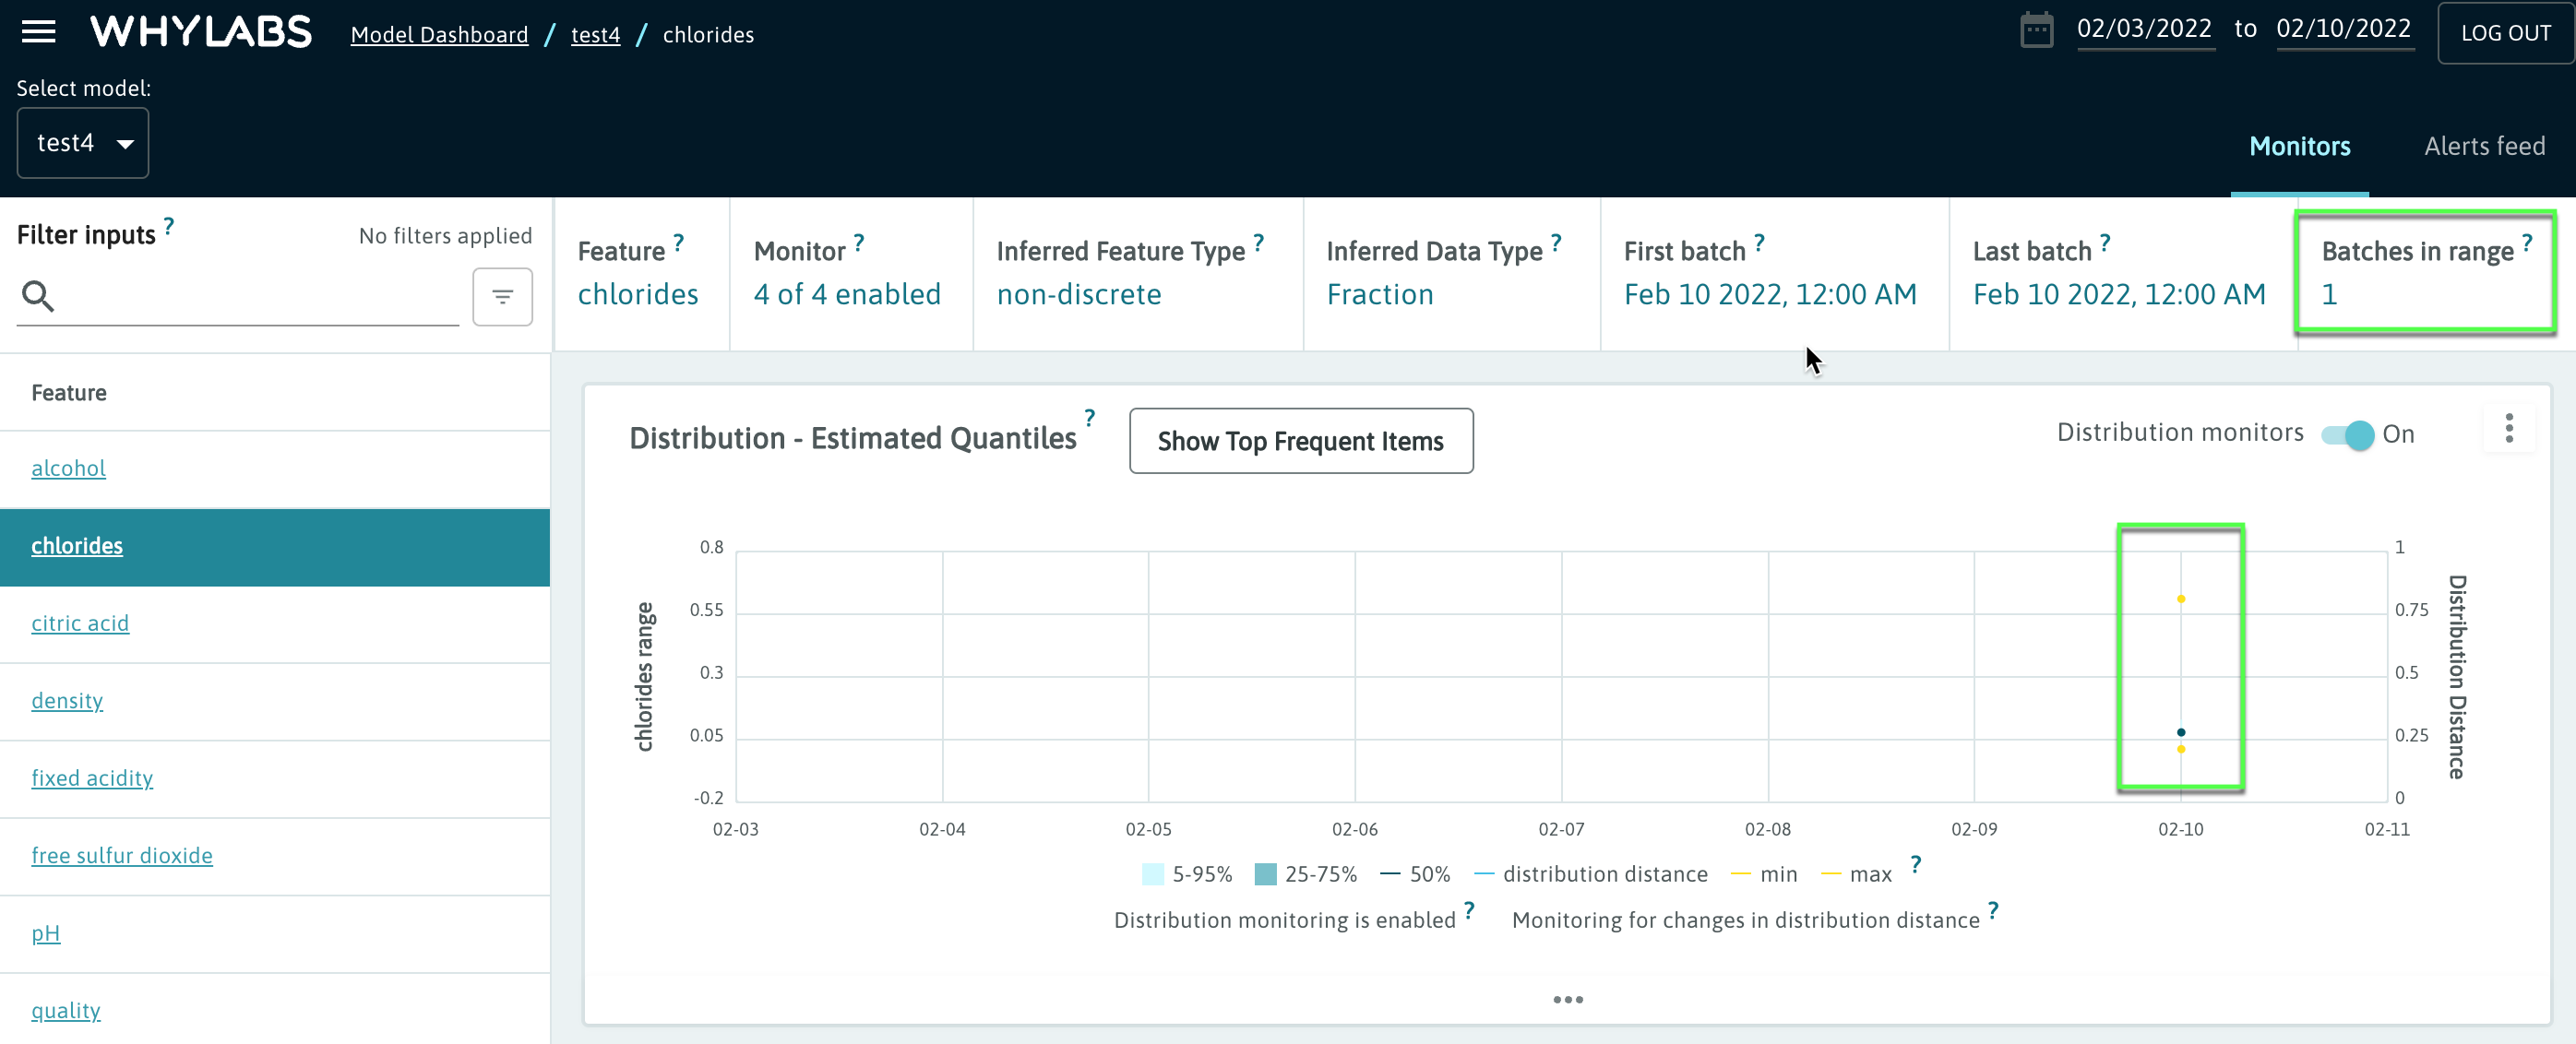
When clicking on a resource from the Resource dashboard, users will be directed to a view containing a summary of anomalies and monitored metrics over the date range chosen in the date picker. This example shows a model resource’s “Inputs” page.
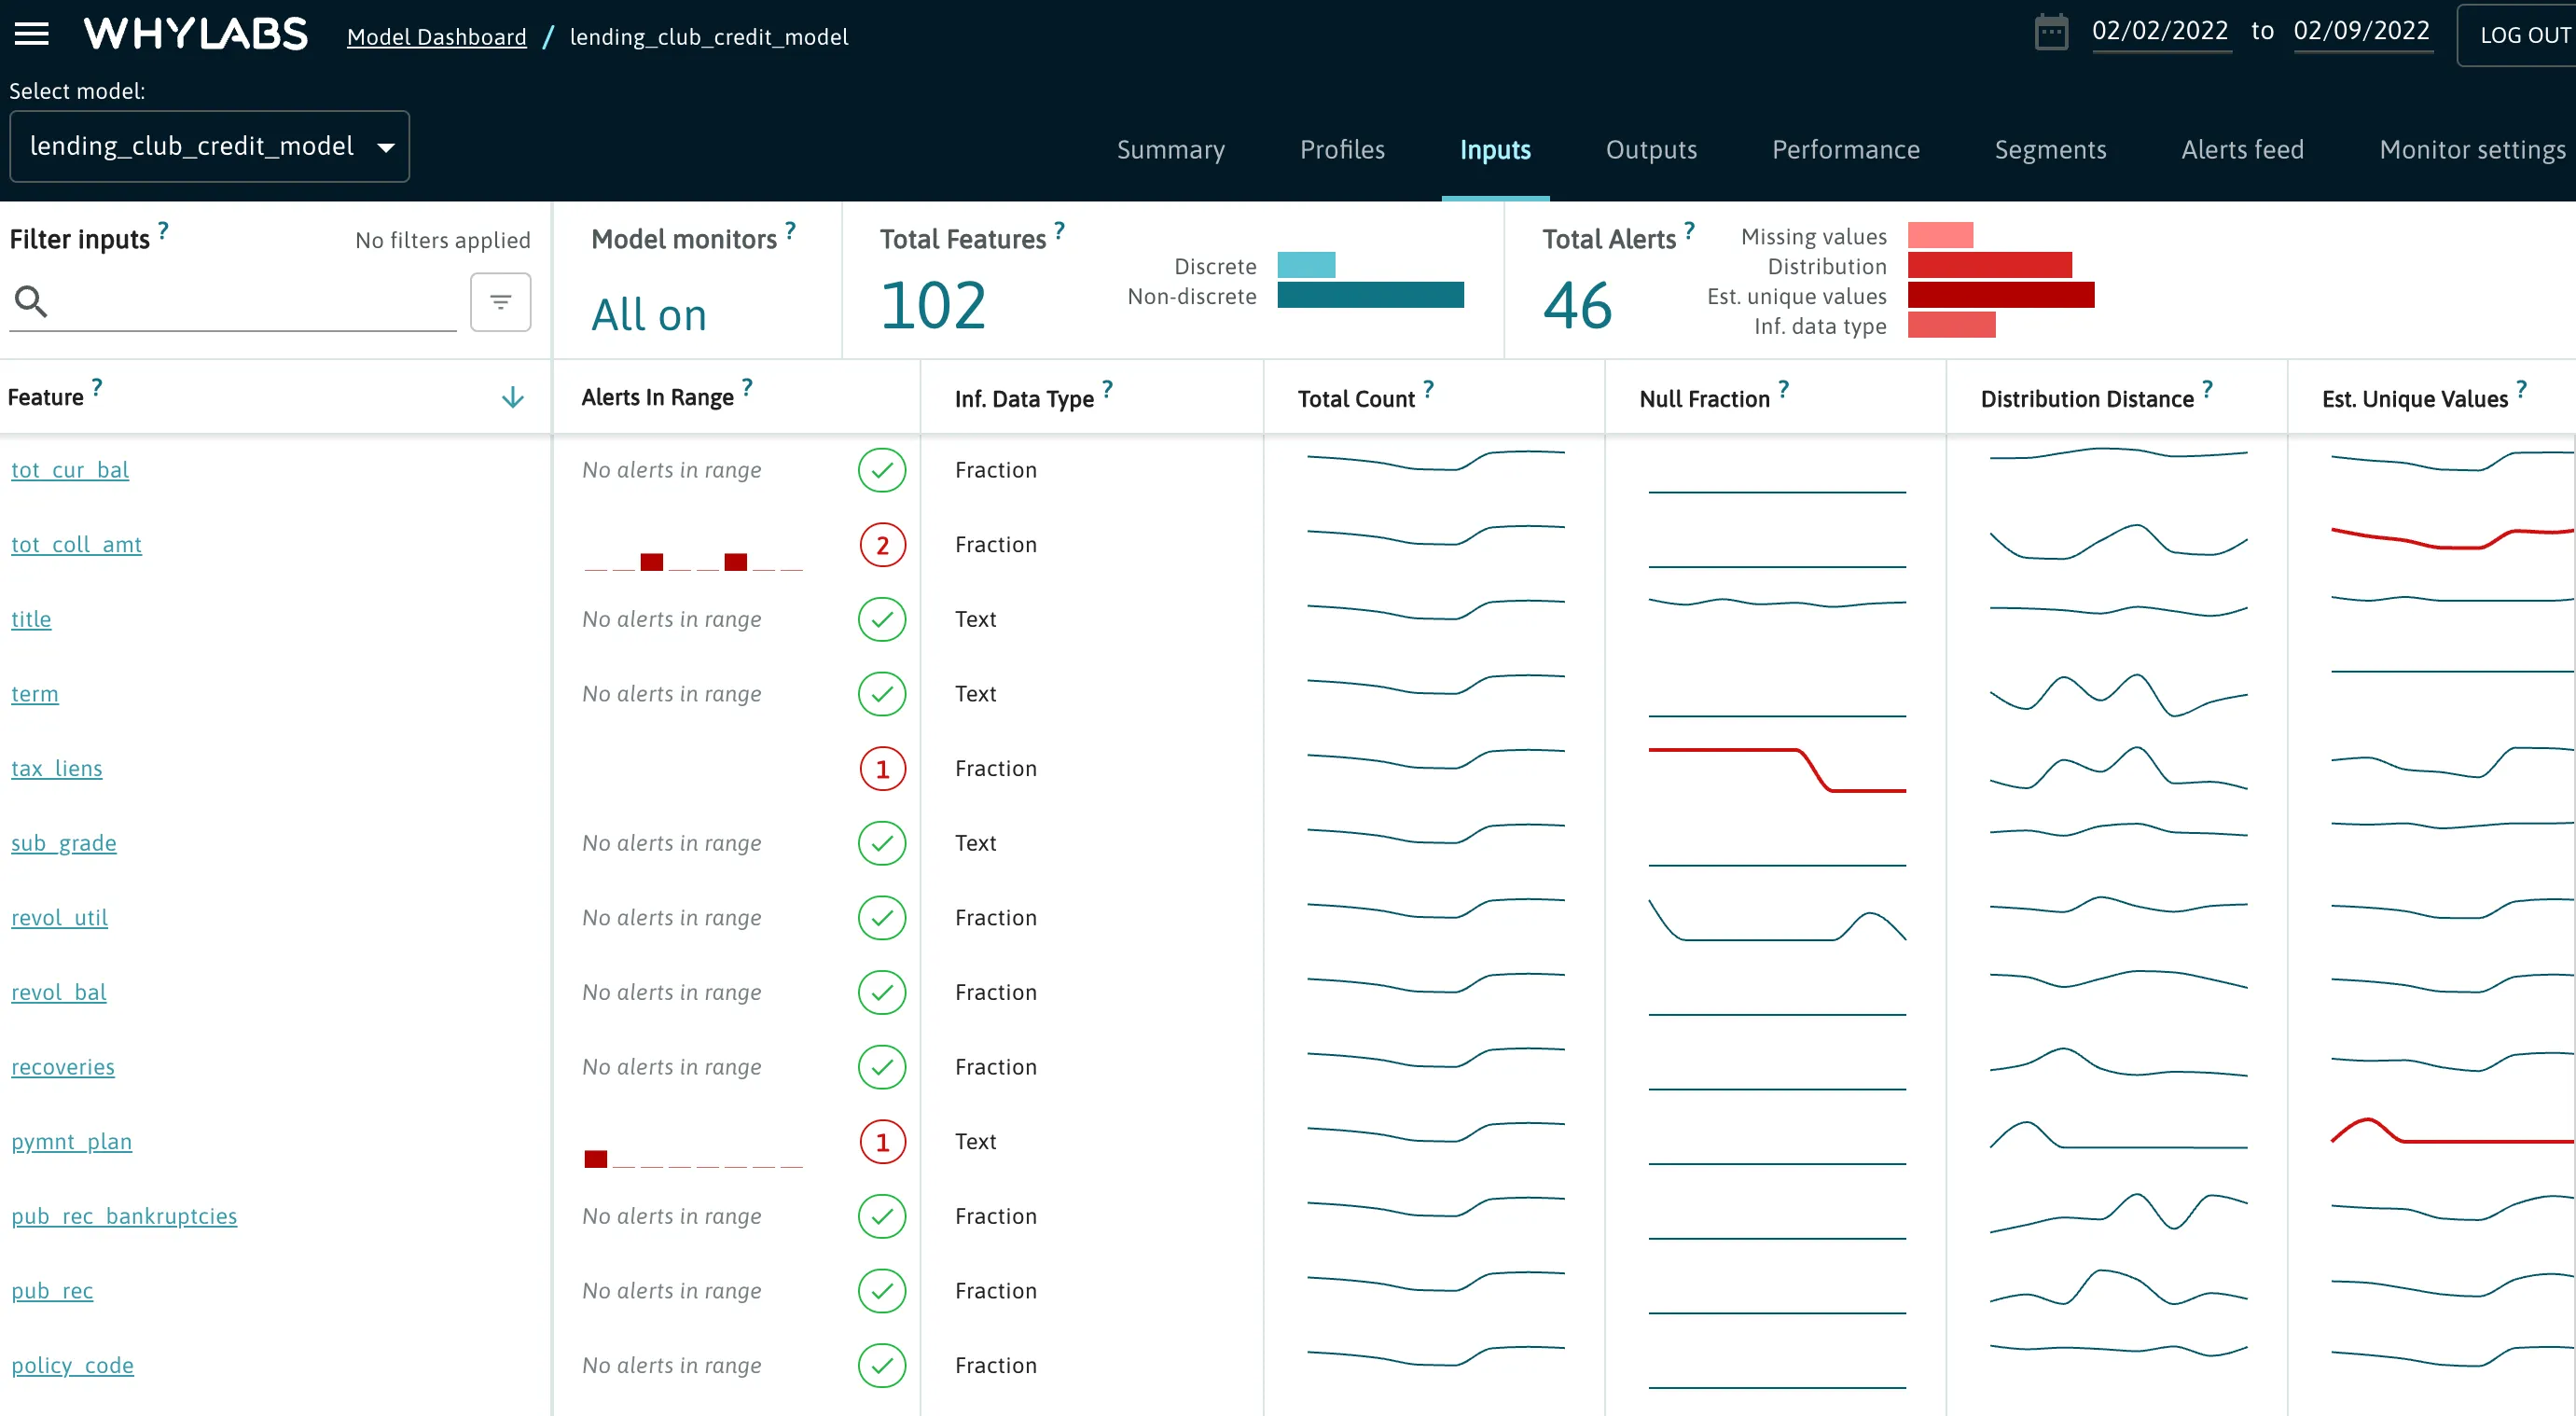
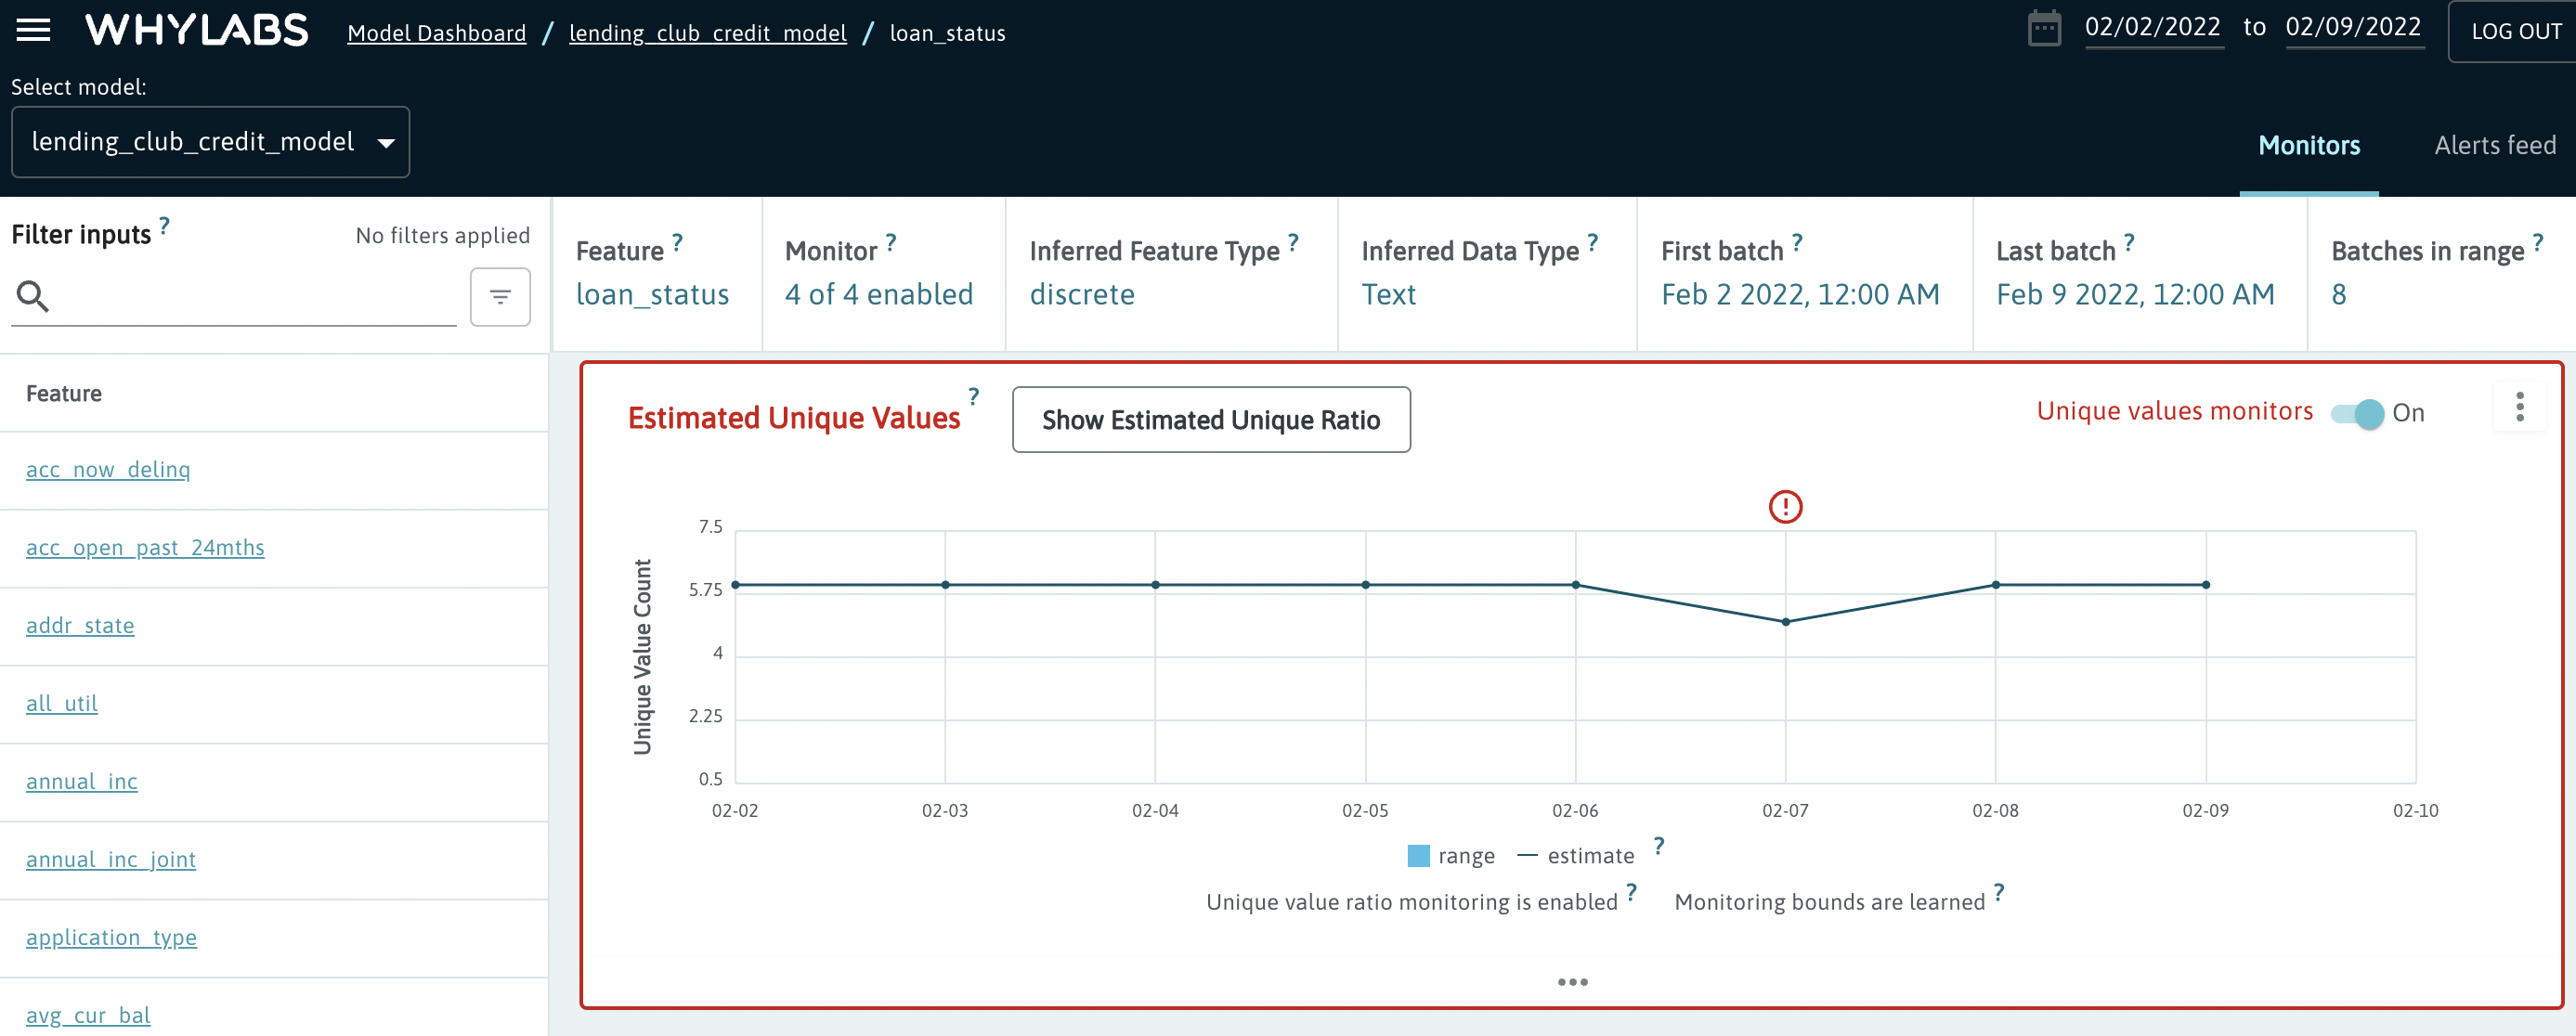
Users can click on one of these features to get a more granular view of each of the monitored metrics as well as the events which triggered alerts. For example, we see that the “loan status” feature contained less unique values than usual on Feb 7th:
Inspecting the profiles
The users can log statistical properties of dataset features, model inputs, and model outputs to enable explorative analysis, data unit testing, and monitoring. The Python code below will profile a dataset and generate a DataFrame capturing basic telemetry describing your data. This represents just a portion of the information captured in a profile.
import whylogs as why
import pandas as pd

df = pd.read_csv("https://whylabs-public.s3.us-west-2.amazonaws.com/datasets/tour/current.csv")

# profile dataframe
results = why.log(pandas=df)

# grab profile object from result set
profile = results.profile()

# grab a view object of the profile for inspection
prof_view = profile.view()

# inspect profile as a Pandas DataFrame
prof_df = prof_view.to_pandas()

