Image Data
In addition to tabular and textual data, whylogs can generate profiles of image data. whylogs automatically computes a number of metrics relative to image data. These include the following.
- Brightness (mean, standard deviation)
- Hue (mean, standard deviation)
- Saturation (mean, standard deviation)
- Image Pixel Height & Width
- Colorspace (e.g. RBG, HSV, CMYK)
We will demonstrate WhyLabs image logging & monitoring capabilities using sets of images with some anomalies injected into the raw data. Consider the following sets of images.
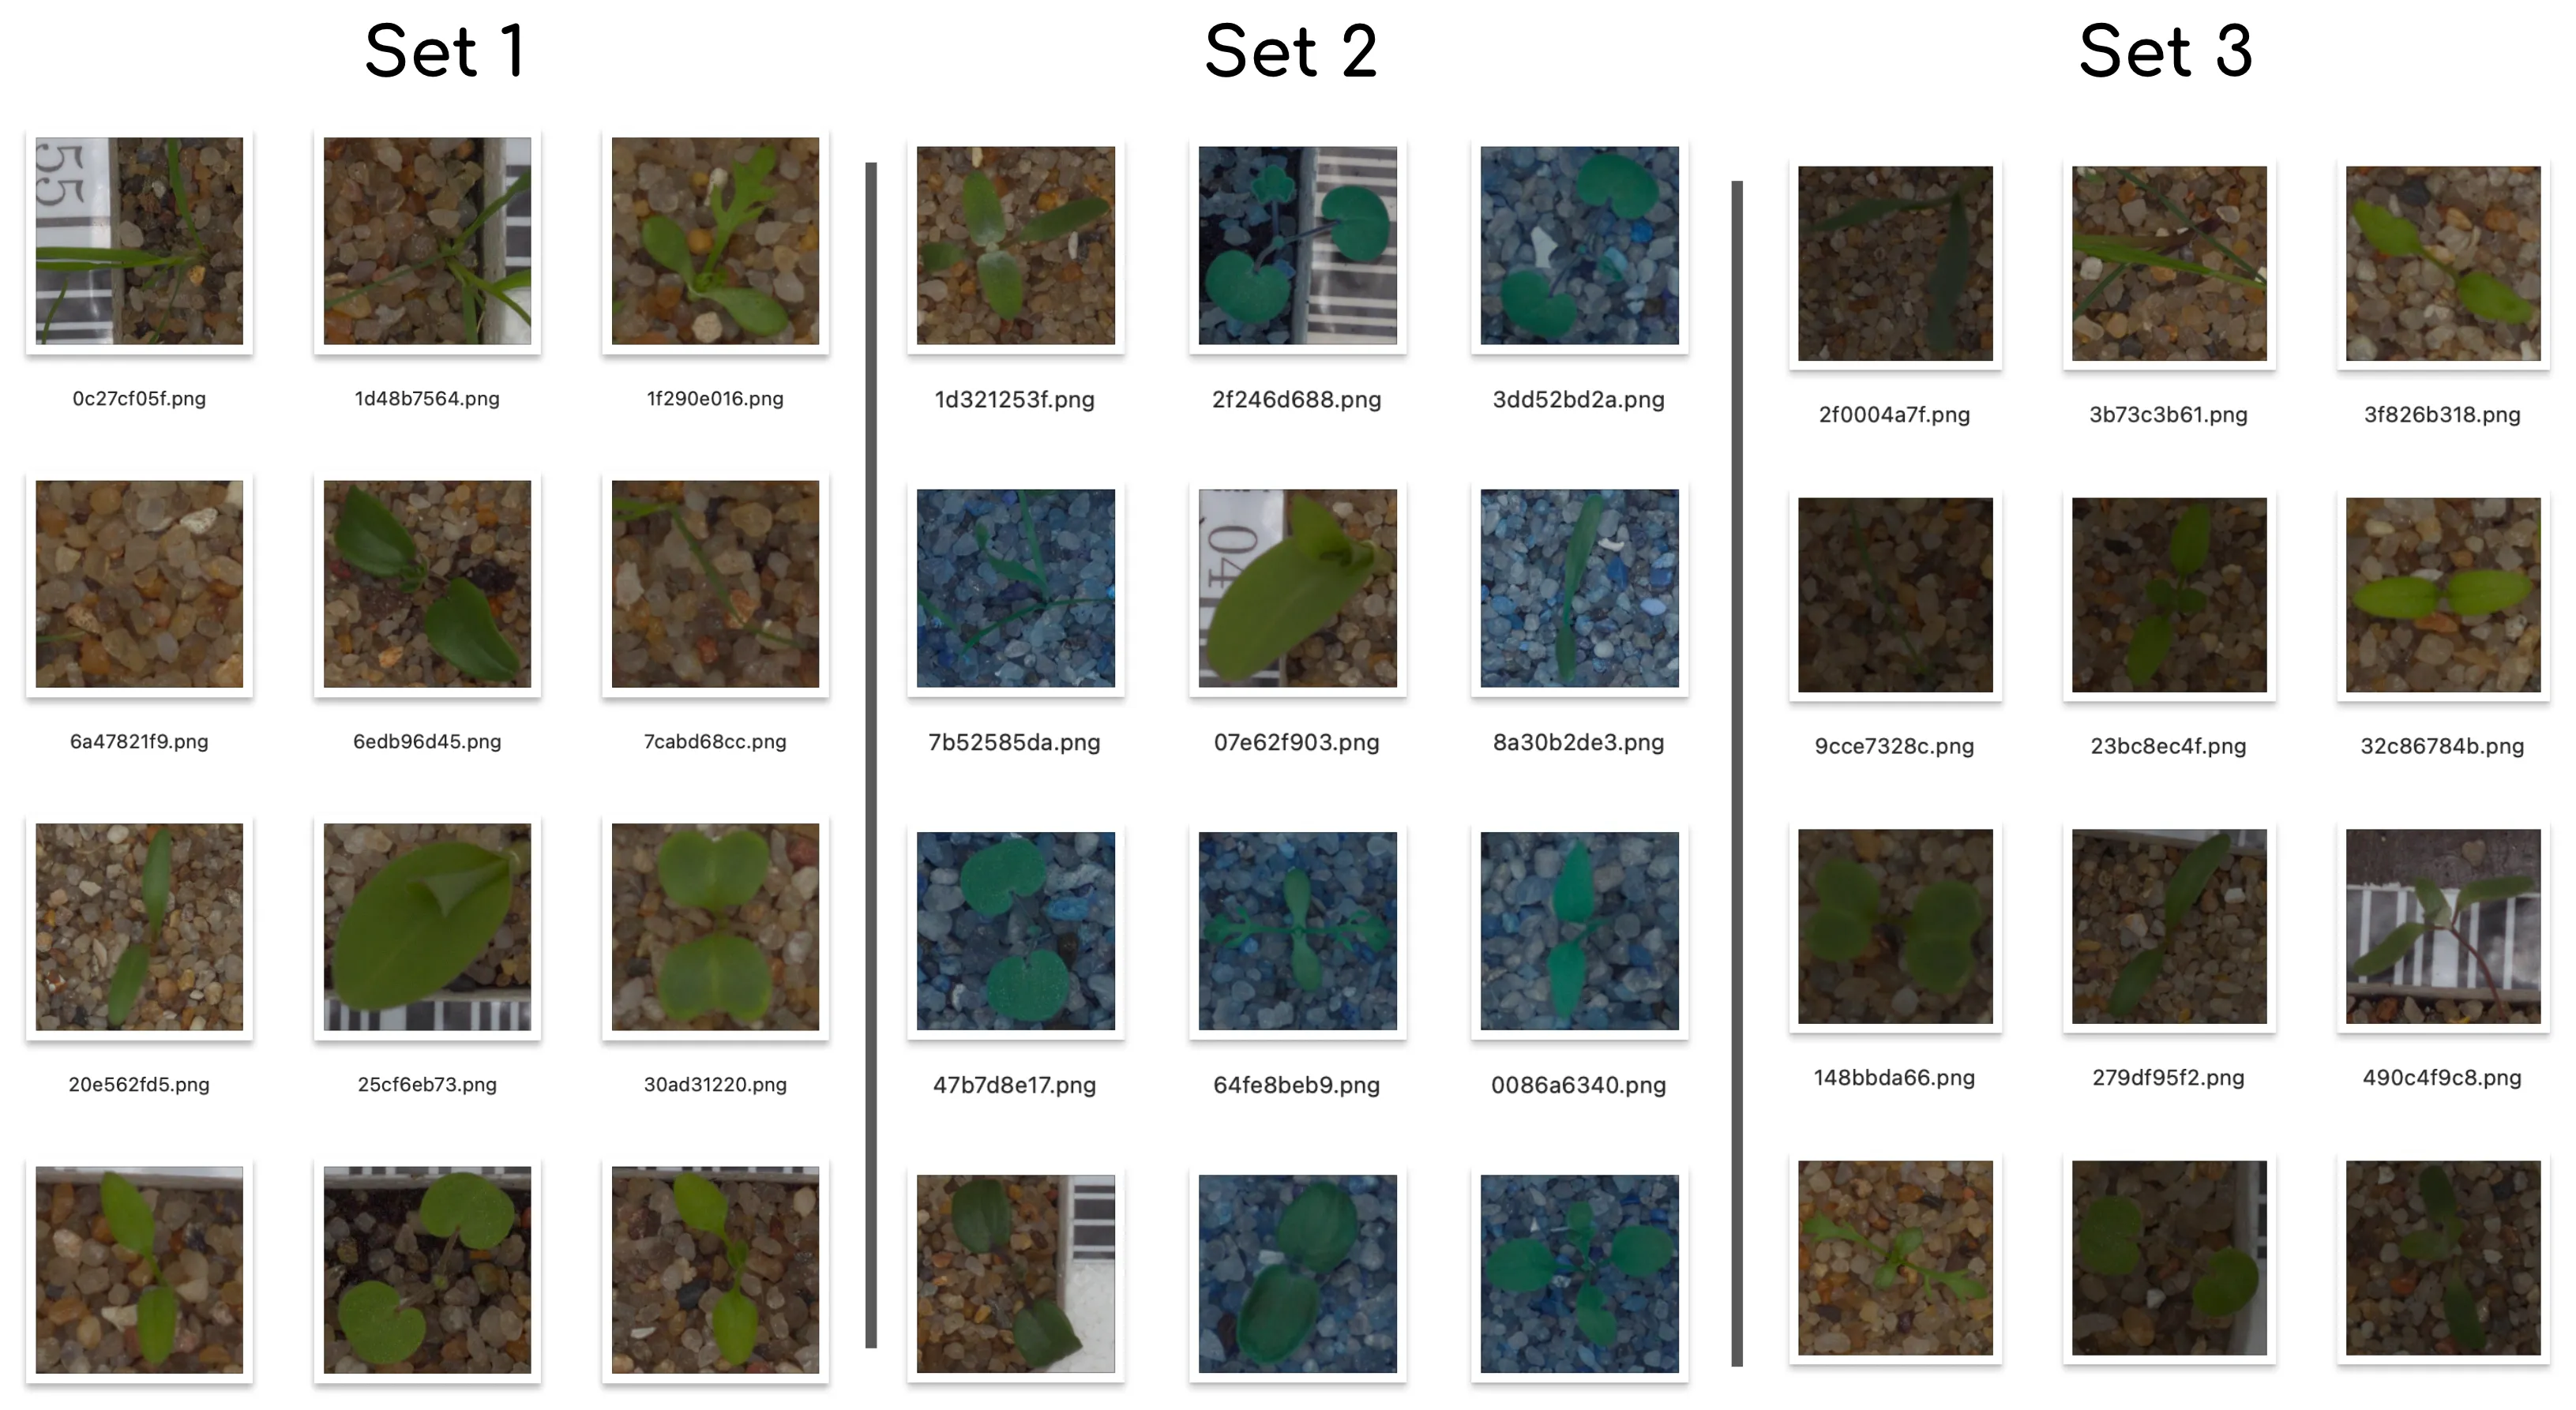
Set 1- These images appear roughly uniform. We will assume this to be our baseline.
Set 2- These images appear to have had their color channels switched which may result from using a different library or library version to read in images or perhaps an issue introduced into the data pipeline.
Set 3- These images appear to have some that are darker than others, which could result from using different devices for taking photographs or different device settings such as shutter speed.
The following code demonstrates how to log a profile for a folder of images.
- whylogs v0
- whylogs v1
# whylogs v0.x can be installed via the following
# pip install "whylogs<1.0"

from whylogs.app import Session
from whylogs.app.writers import WhyLabsWriter
import os

os.environ["WHYLABS_API_KEY"] = # your api key
os.environ["WHYLABS_DEFAULT_ORG_ID"] = # your org-id
model_id= # your model-id

# Creating instance of the WhyLabs Writer to utilize WhyLabs platform
writer = WhyLabsWriter()

# Open a session
session = Session(project="demo-project", pipeline="demo-pipeline", writers=[writer])

# initialize a logger object and log each image in folder via for loop
with session.logger(tags={"datasetId": model_id}) as ylog:
    for img_name in os.listdir('image_folder'):
        ylog.log_image('image_folder/' + img_name)
# Be sure to install whylogs with the image and whylabs extras
# pip install whylogs[image,whylabs]

from PIL import Image
from whylogs.extras.image_metric import log_image
from whylogs.api.writer.whylabs import WhyLabsWriter
import os


os.environ["WHYLABS_DEFAULT_ORG_ID"] = 'YOUR-ORG-ID'
os.environ["WHYLABS_API_KEY"] = 'YOUR-API-KEY'
os.environ["WHYLABS_DEFAULT_DATASET_ID"] = 'YOUR-MODEL-ID'

merged_profile = None

for img_name in os.listdir('image_folder'):

    img = Image.open('image_folder/' + img_name) # read in image
    profile = log_image(img).profile() # generate profile
    profile.set_dataset_timestamp(datetime) # optionally set dataset_timestamp
    profile_view = profile.view() # extract mergeable profile view

    # merge each profile while looping
    if merged_profile is None:
      merged_profile = profile_view
    else:
      merged_profile = merged_profile.merge(profile_view)

writer = WhyLabsWriter()
writer.write(merged_profile)
Note that the log_image method only accepts a single image as input. Users are advised to loop through their collection of images within a single logger session to log an aggregate profile for their image set.
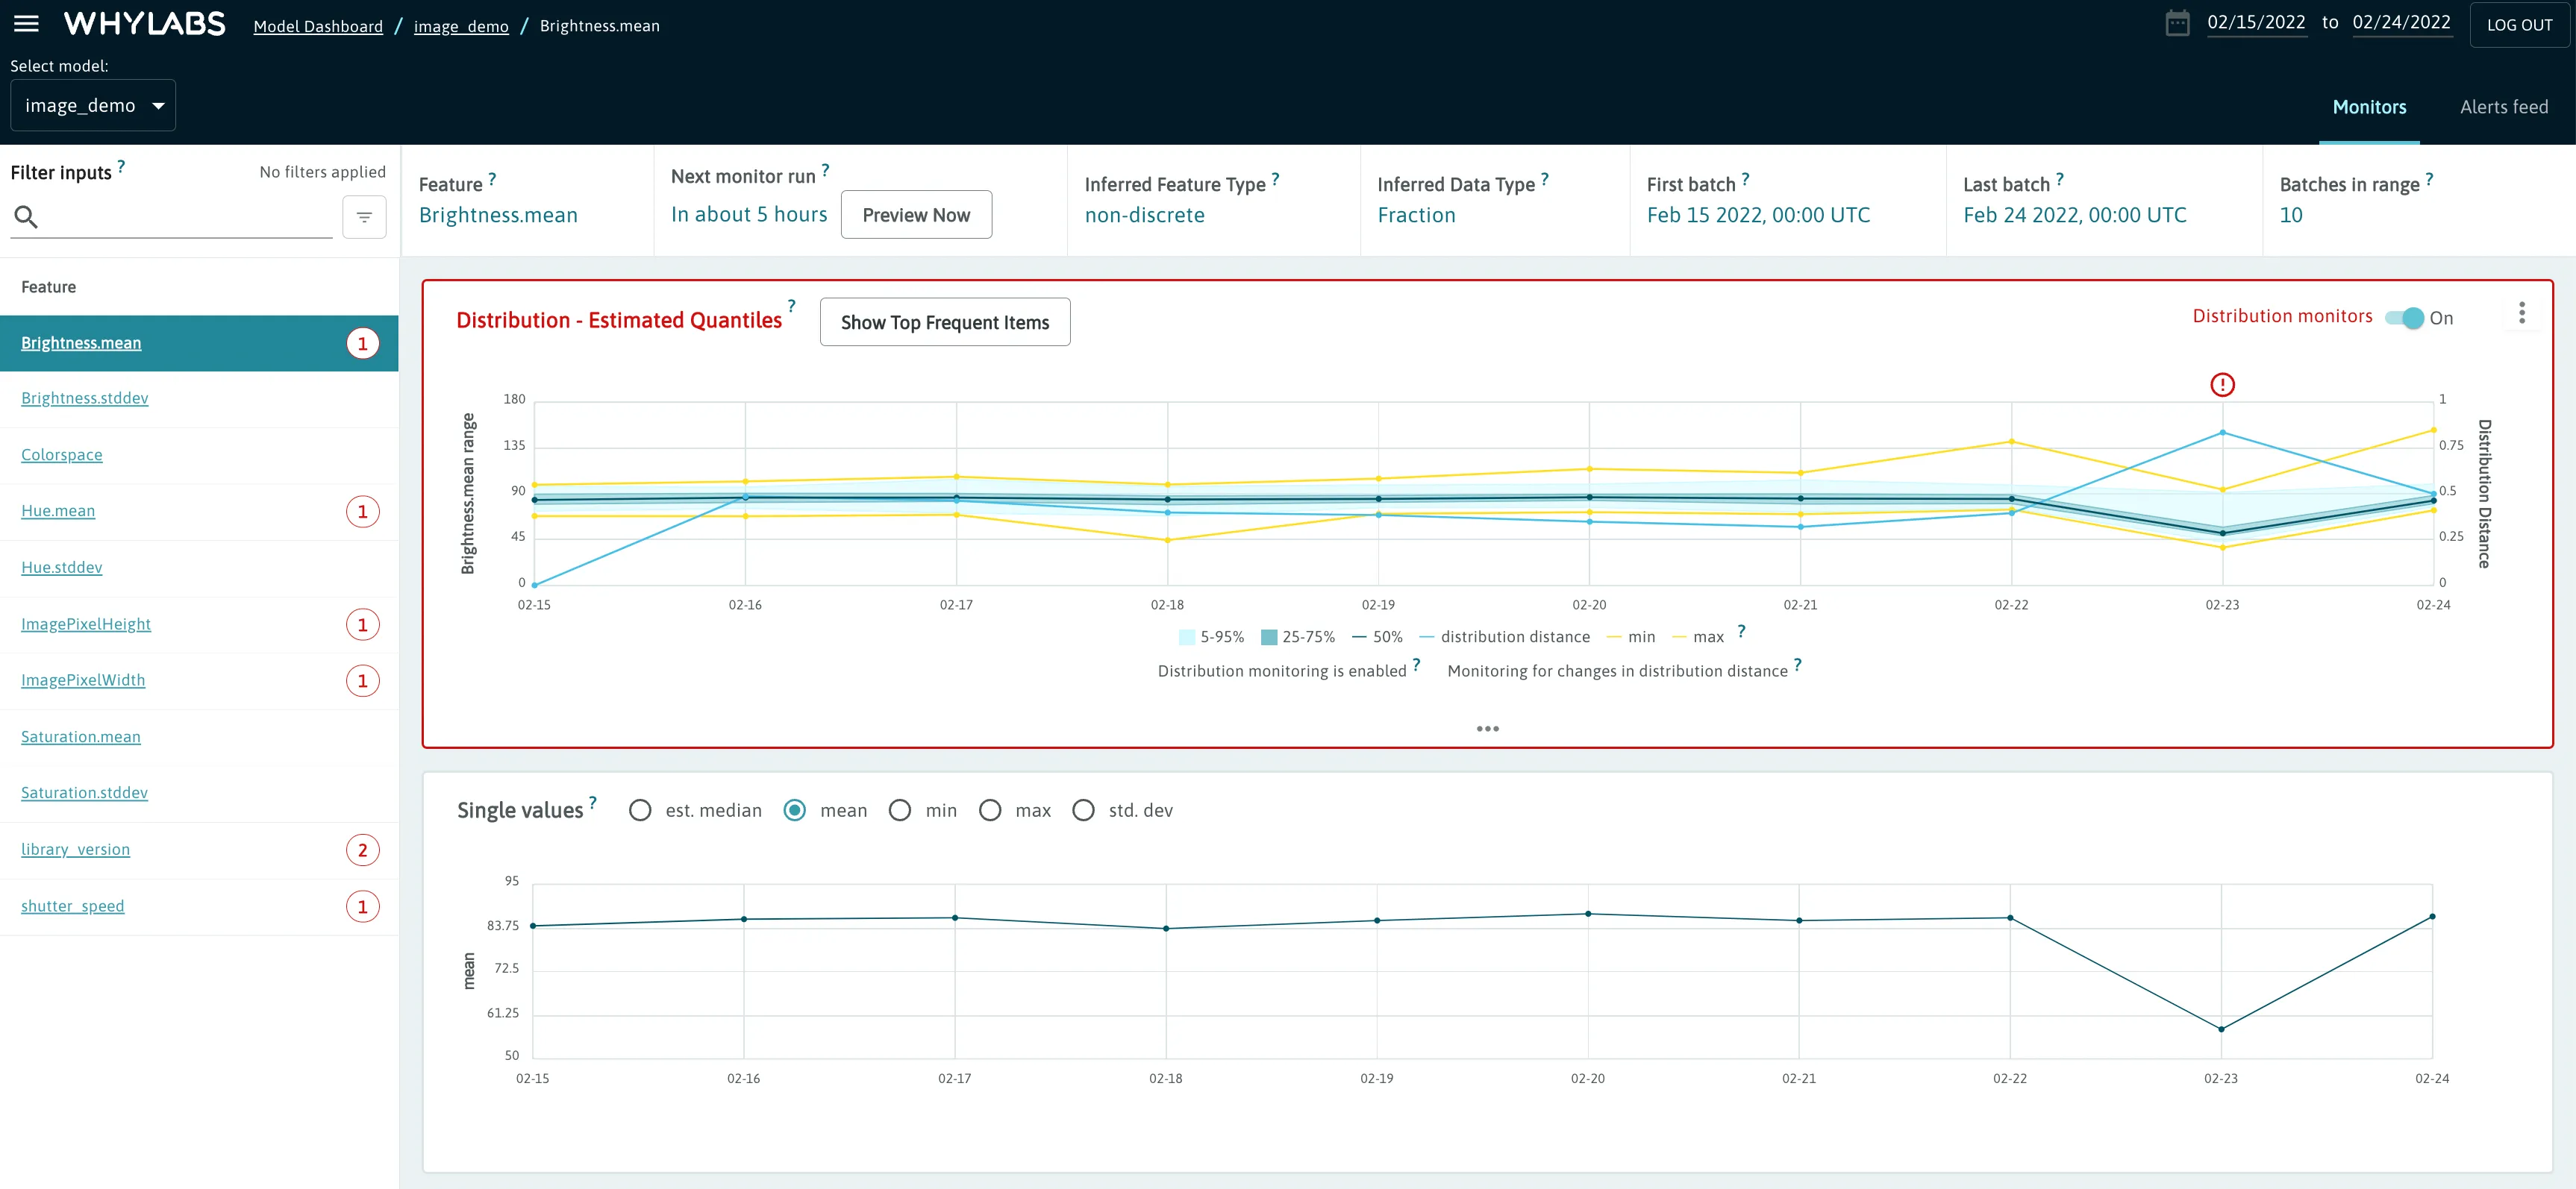
Once uploaded to WhyLabs, these metrics are tracked similarly to descriptive statistics generated when profiling tabular data. In the image below, we see that the mean brightness of logged images suddenly dropped on February 23rd, causing a spike in the distribution distance as compared to the reference profile. This anomaly is associated with images from Set 3.
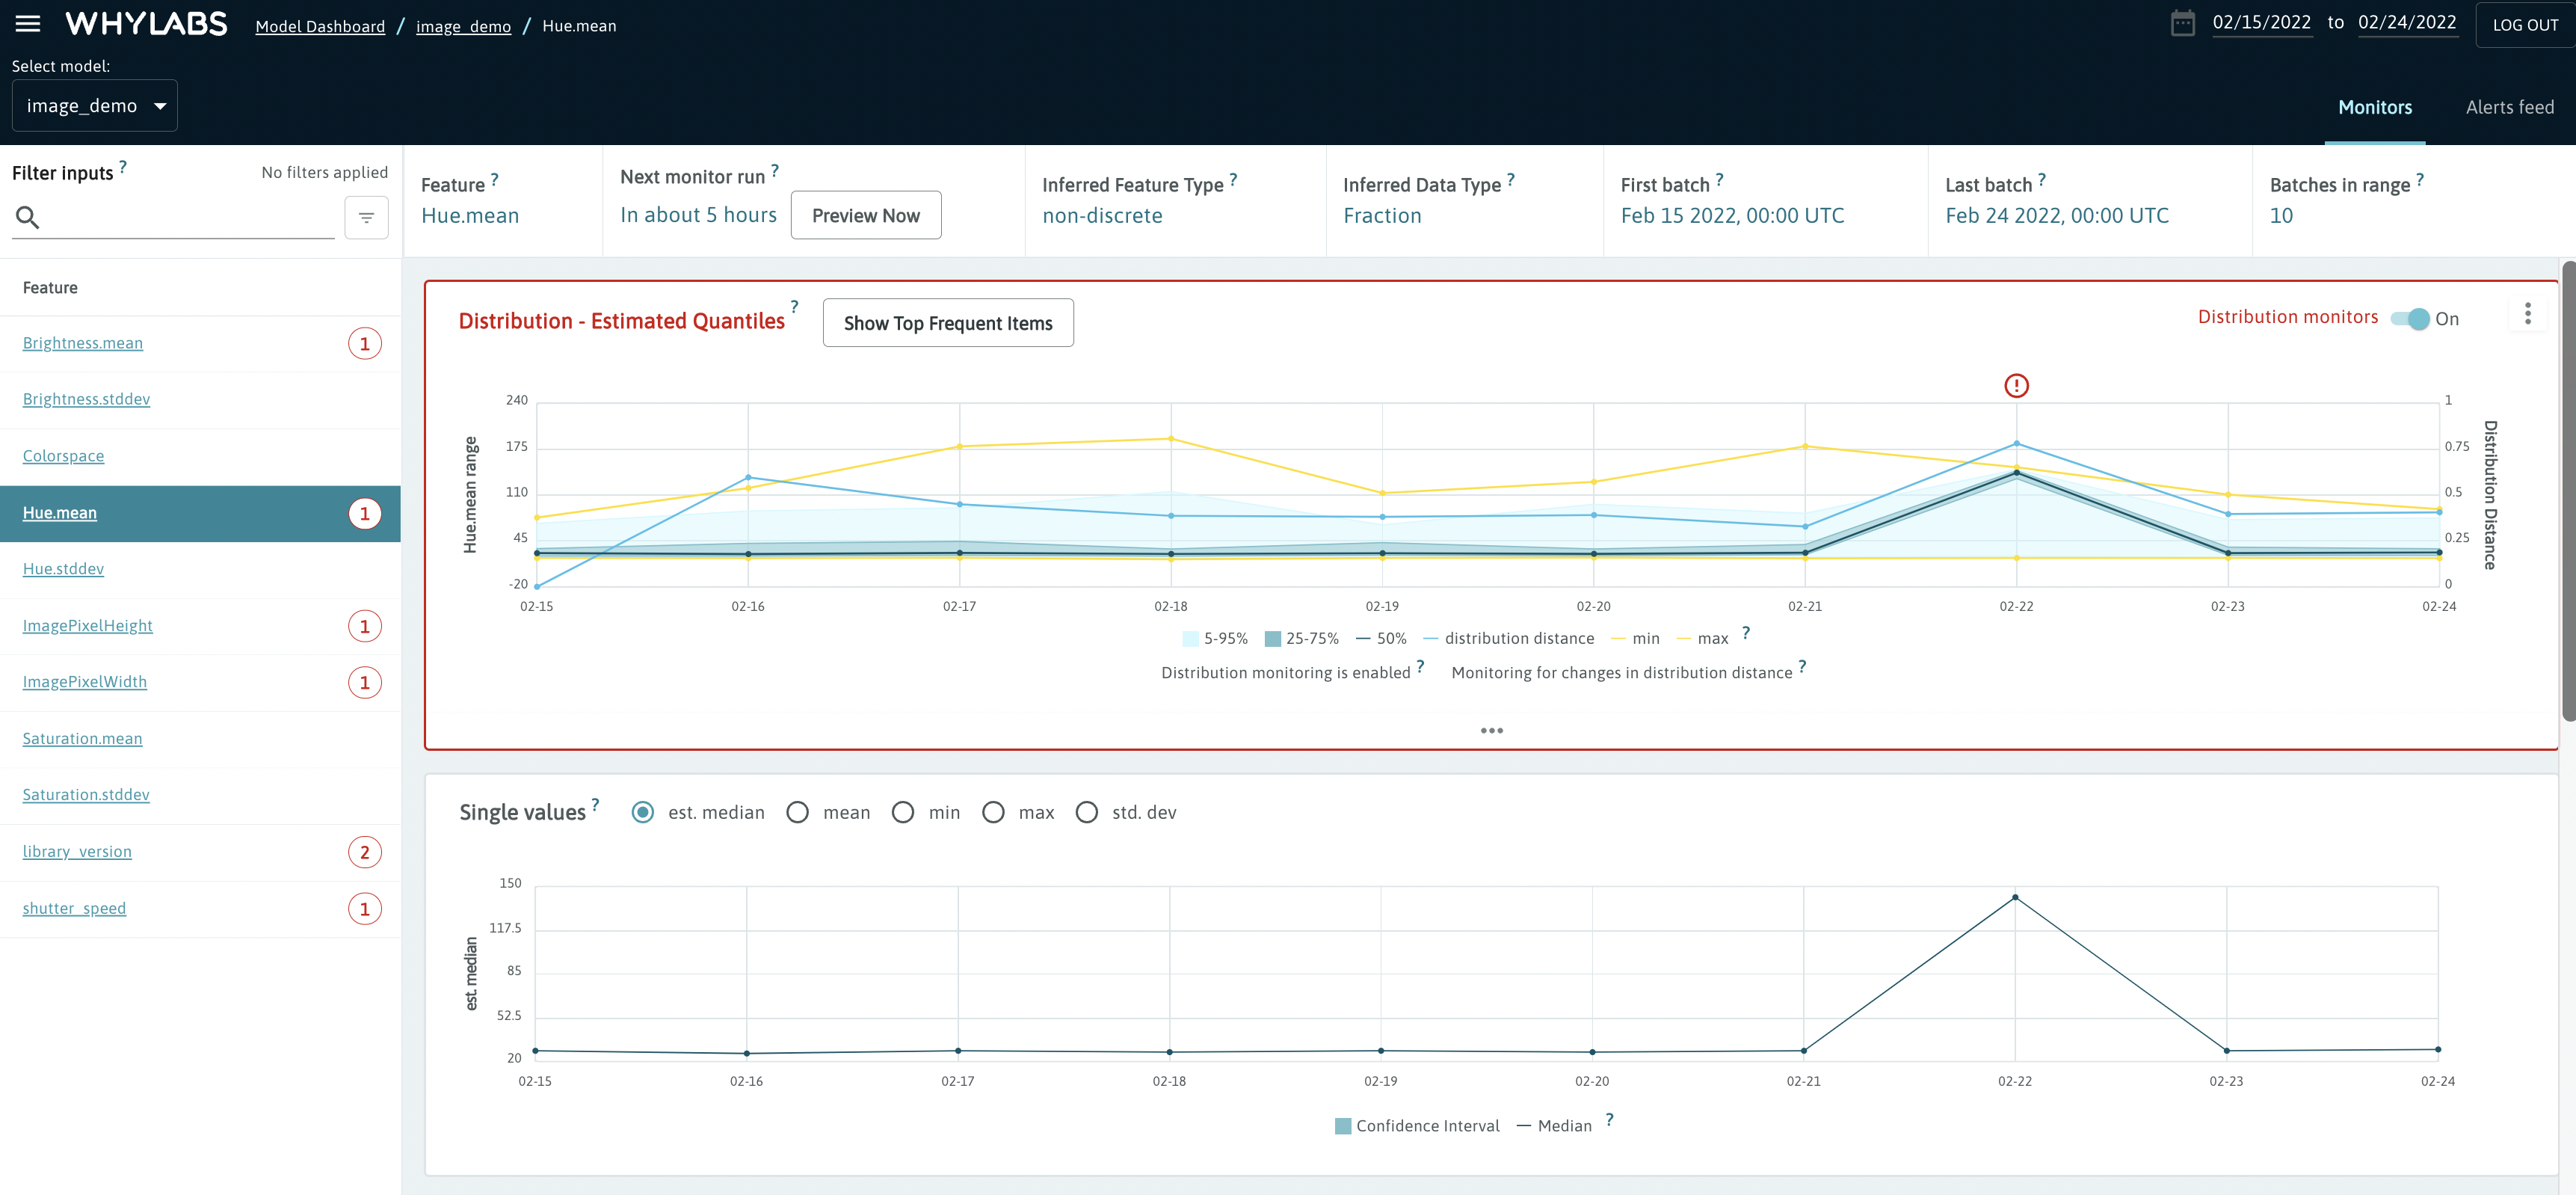
Similarly, we see a spike in the image hue on February 22nd, which corresponds to the swapped color channels in Set 2.
Multi-Modal Logging
Furthermore, users can combine profiles from different data types into a single WhyLabs model due to the mergeability property of whylogs profiles. This is useful for cases in which multi-modal models are used, or if there is metadata available to supplement your dataset.
Suppose each image set was associated with a tabular dataset containing metadata like the shutter speed and library version associated with the camera used for the photograph and the image library used for pre-processing. This tabular metadata can be included in the logged profiles by adjusting the previous code as follows.
- whylogs v0
- whylogs v1
# Note- logging image data is not yet supported by whylogs v1
# whylogs v0.x can be installed via the following
# pip install "whylogs<1.0"

with session.logger(tags={"datasetId": model_id}) as ylog:

    # read in tabular metadata
    metadata_df= pd.read_csv('image_metadata.csv')
    # log tabular metadata
    ylog.log_dataframe(metadata_df)

    for img_name in os.listdir('image_folder'):
        ylog.log_image('image_folder/' + img_name)
from typing import Dict

import whylogs as why
from whylogs.core.datatypes import DataType
from whylogs.core.metrics import Metric, MetricConfig
from whylogs.core.resolvers import StandardResolver
from whylogs.core.schema import DatasetSchema, ColumnSchema
from whylogs.extras.image_metric import ImageMetric

class ImageResolver(StandardResolver):
  def resolve(self, name: str, why_type: DataType, column_schema: ColumnSchema) -> Dict[str, Metric]:
    if "image" in name:
      return {ImageMetric.get_namespace(MetricConfig()): ImageMetric.zero(column_schema.cfg)}
    return super(ImageResolver, self).resolve(name, why_type, column_schema)

schema = DatasetSchema(resolvers=ImageResolver())

# here, img is an instance of the PIL 'Image' class
results = why.log(row={"library_version": "3.6.9", "shutter_speed":100 "images": img}, schema=schema)
profile_view = results.profile().view()
writer.write(profile_view)
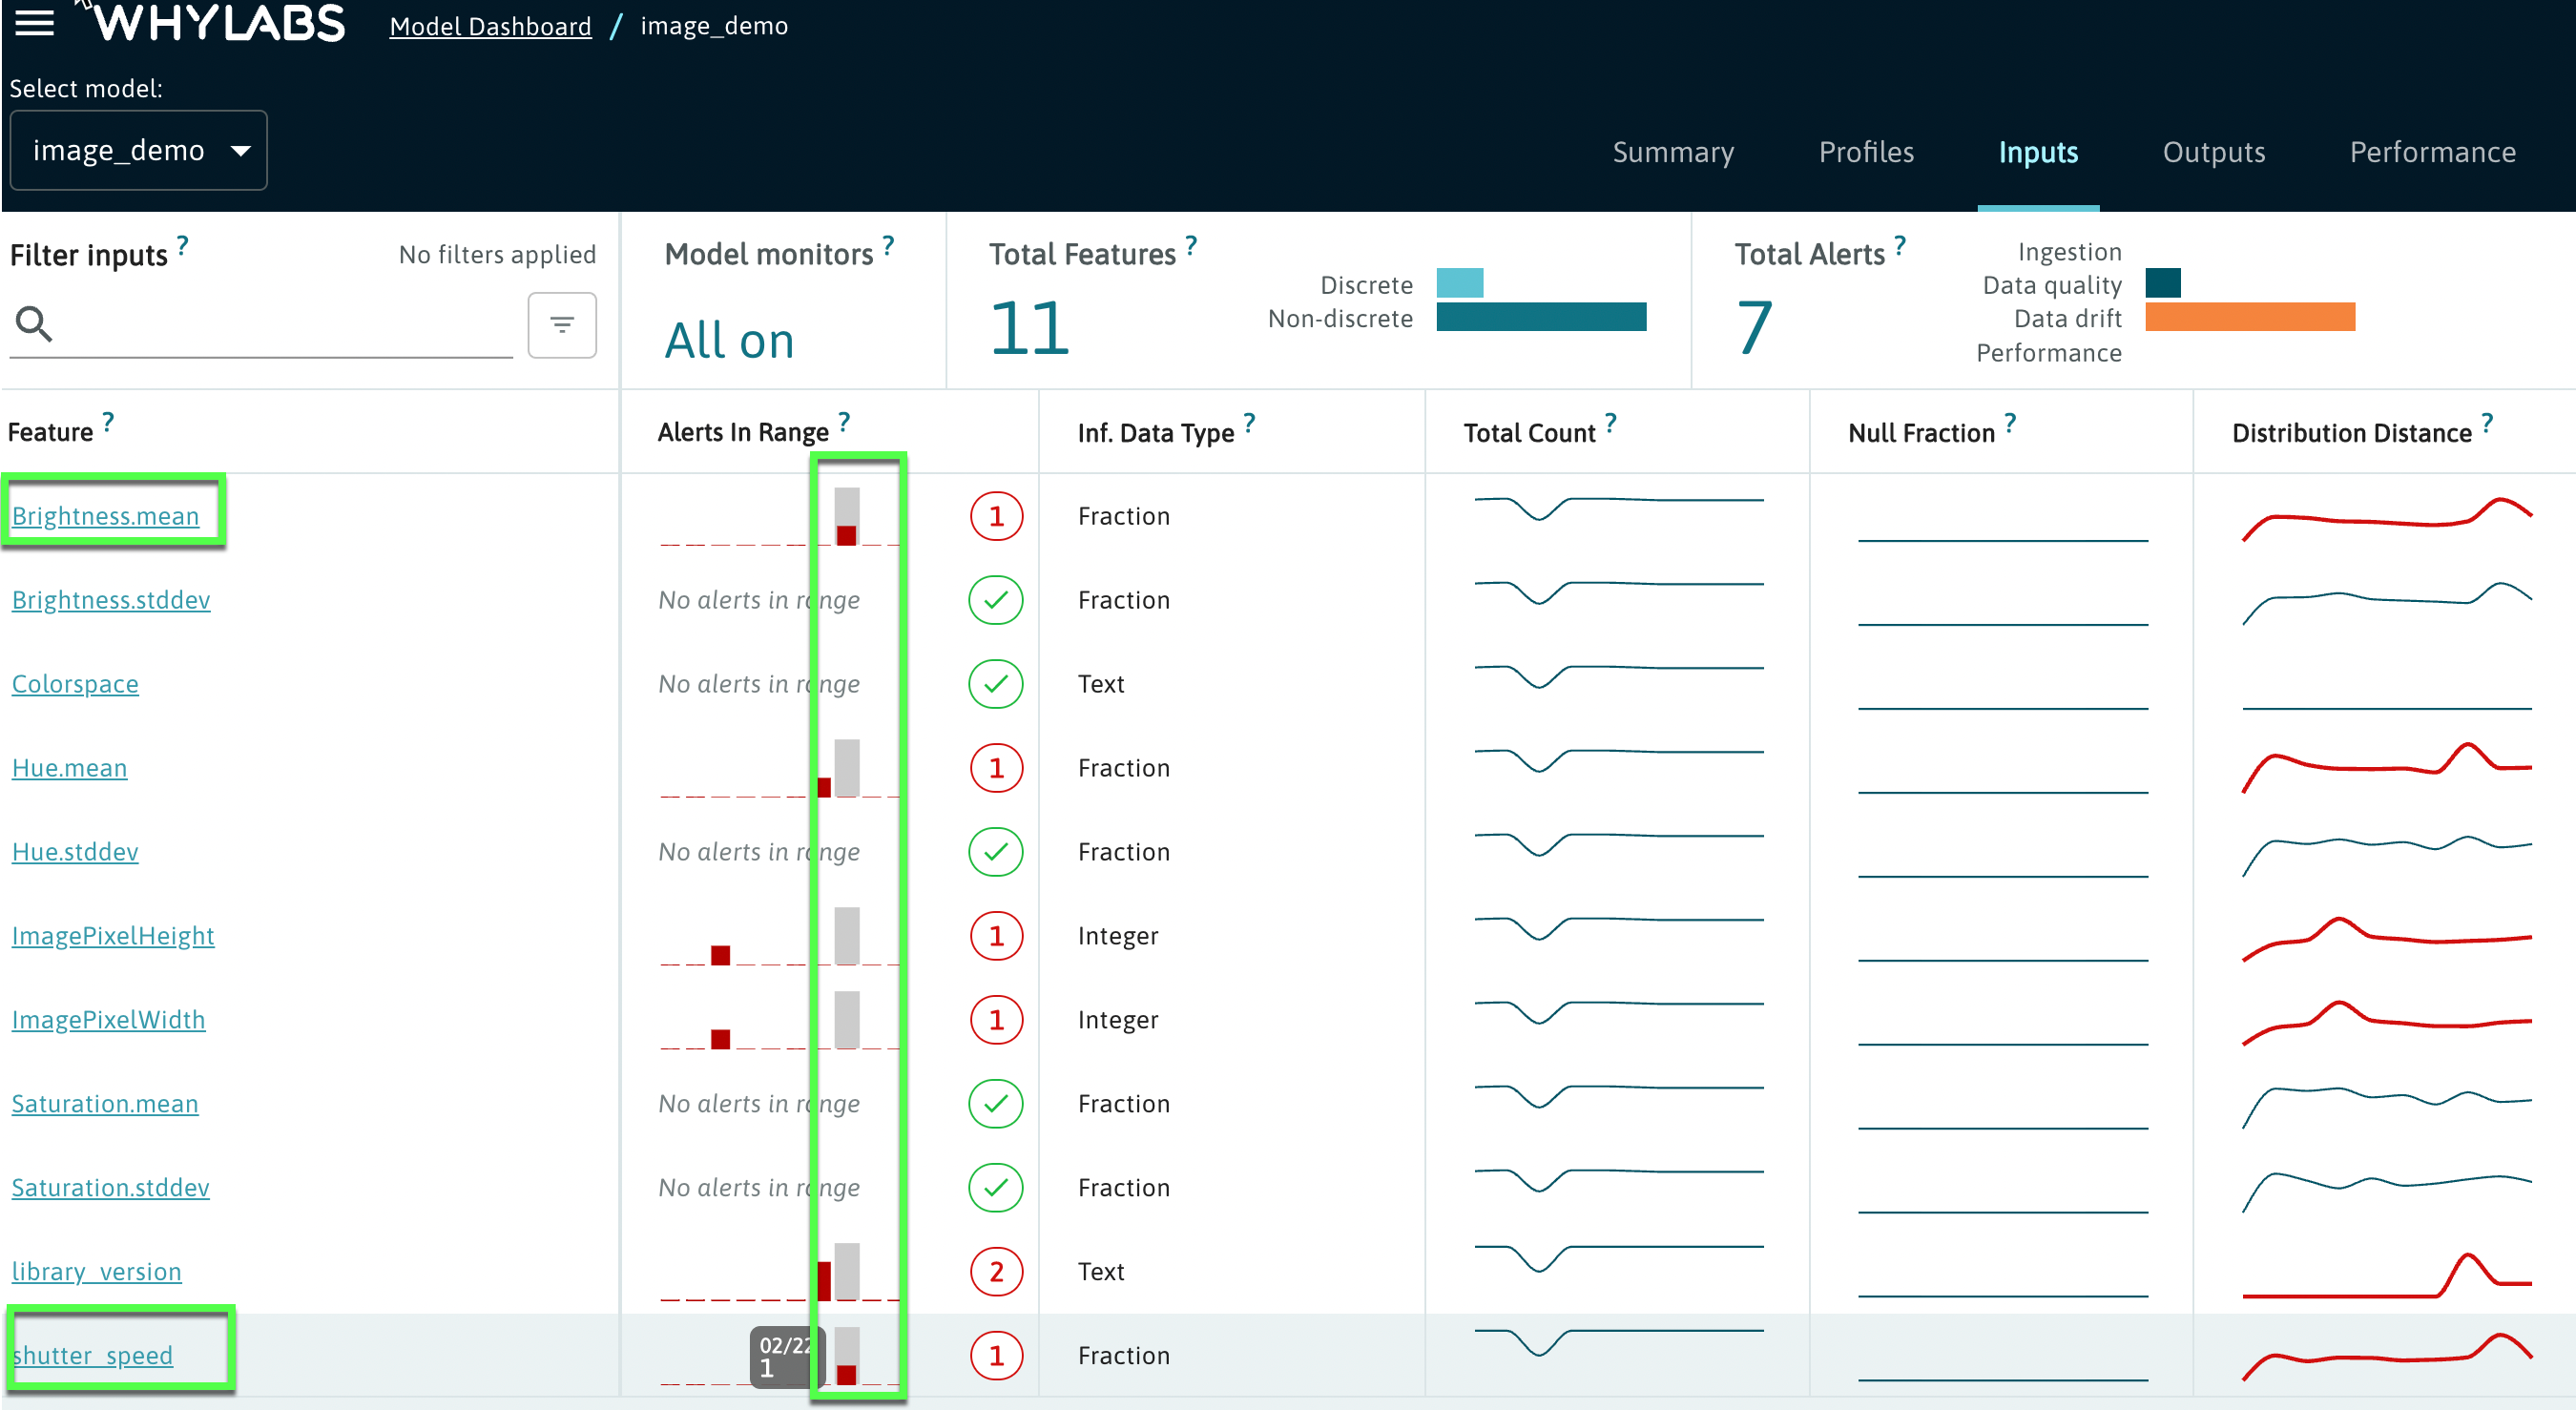
When viewing the results in WhyLabs, we now see that the tabular metadata is monitored alongside the image data. In fact, this can be used to help troubleshoot in some cases. In the image below, we find that an anomaly in brightness correlates with an anomaly in the shutter speed used.
Exif Data
Some images contain EXIF data which typically includes metadata stored by the device which took a photograph. If EXIF data is available for images profiled by whylogs, it will automatically be included in the image profile.
Custom Metrics
Computer vision use cases can be highly specific. For this reason, users are able to define their own custom functions to operate on an image array when logging an image profile. In the following example, a custom function is built to extract the blue channel of the image.
- whylogs v0
- whylogs v1
# Note- logging image data is not yet supported by whylogs v1
# whylogs v0.x can be installed via the following
# pip install "whylogs<1.0"

class MyBlue:
    def __call__(self, x):
        _,_,b= x.split()
        return np.array(b).reshape(-1,1)
    def __repr__(self,):
        return self.__class__.__name__

with session.logger(tags={"datasetId": model_id}) as ylog:
    ylog.log_image('filename.png', feature_transforms = [MyBlue(), ComposeTransforms([MyBlue()])])
#coming soon!

