Embeddings Data
With WhyLabs, you are able to profile embeddings data by comparing them to reference data points. These references can be completely determined by users (helpful when they represent prototypical "ideal" representations of a cluster or scenario) but can also be chosen programmatically.
To use this functionality, perform the following steps:
- Choose reference embeddings
- Log with whylogs after adding metric configuration and resolver for the
EmbeddingMetric - View and (optionally) add monitors in whylogs
Logging and monitoring embeddings data
To get started, install whylogs with the embeddings and whylabs extras:
⚠️ Note that embeddings are only available in whylogs >= 1.1.22.
pip install --upgrade "whylogs[embeddings,whylabs]"
Choosing reference embeddings
Reference embeddings can be chosen manually, but we provide functions for choosing references programmatically as well.
- Manual
- With labels
- Without labels
You may select or create references manually. Ensure the data is in a two-dimensional numpy.ndarray with shape (number of references, dimensionality of embeddings). You may optionally assign text labels to each reference, otherwise they will be referenced with integers.
Number of references should remain less than 50.
Here, X is a two-dimensional numpy.ndarray of training vectors with shape (number of vectors, dimensionality of embeddings), and y is a one dimensional numpy.ndarray of labels (integers or strings) of the training vectors.
from whylogs.experimental.preprocess.embeddings.selectors import PCACentroidsSelector

references, labels = PCACentroidsSelector(n_components=20).calculate_references(X, y)
The n_components must be less than embeddings dimensionality, but high enough to capture primary shape of the data. Values between 10-50 often work well in practice.
Here, X is a two-dimensional numpy.ndarray of training vectors with shape (number of vectors, dimensionality of embeddings).
from whylogs.experimental.preprocess.embeddings.selectors import PCAKMeansSelector

references, labels = PCAKMeansSelector(n_clusters=8, n_components=20).calculate_references(X)
Labels will be consecutive integers starting at 0.
The n_clusters will determine the number of references. The n_components must be less than embeddings dimensionality, but high enough to capture primary shape of the data. Values between 10-50 often work well in practice.
Log embeddings in whylogs
Here, X is a two-dimensional numpy.ndarray of embedding vectors to log with shape (number of vectors, dimensionality of embeddings).
Log using the following code:
import whylogs as why
from whylogs.core.resolvers import MetricSpec, ResolverSpec
from whylogs.core.schema import DeclarativeSchema
from whylogs.experimental.extras.embedding_metric import (
    DistanceFunction,
    EmbeddingConfig,
    EmbeddingMetric,
)

# Configuring EmbeddingMetric
config = EmbeddingConfig(
    references=references,
    labels=labels,
    distance_fn=DistanceFunction.euclidean,
)

# Setting resolver
schema = DeclarativeSchema([ResolverSpec(column_name="FEATURE_NAME", metrics=[MetricSpec(EmbeddingMetric, config)])])

# Logging
profile = why.log(row={"FEATURE_NAME": X})

# Uploading to WhyLabs
os.environ["WHYLABS_DEFAULT_ORG_ID"] = 'YOUR-ORG-ID'
os.environ["WHYLABS_API_KEY"] = 'YOUR-API-KEY'
os.environ["WHYLABS_DEFAULT_DATASET_ID"] = 'YOUR-MODEL-ID'

writer = WhyLabsWriter()
writer.write(profile)
Viewing and Monitoring in WhyLabs
Visualizations
You can see initial visualizations in WhyLabs, but many more are forthcoming in both whylogs and WhyLabs!
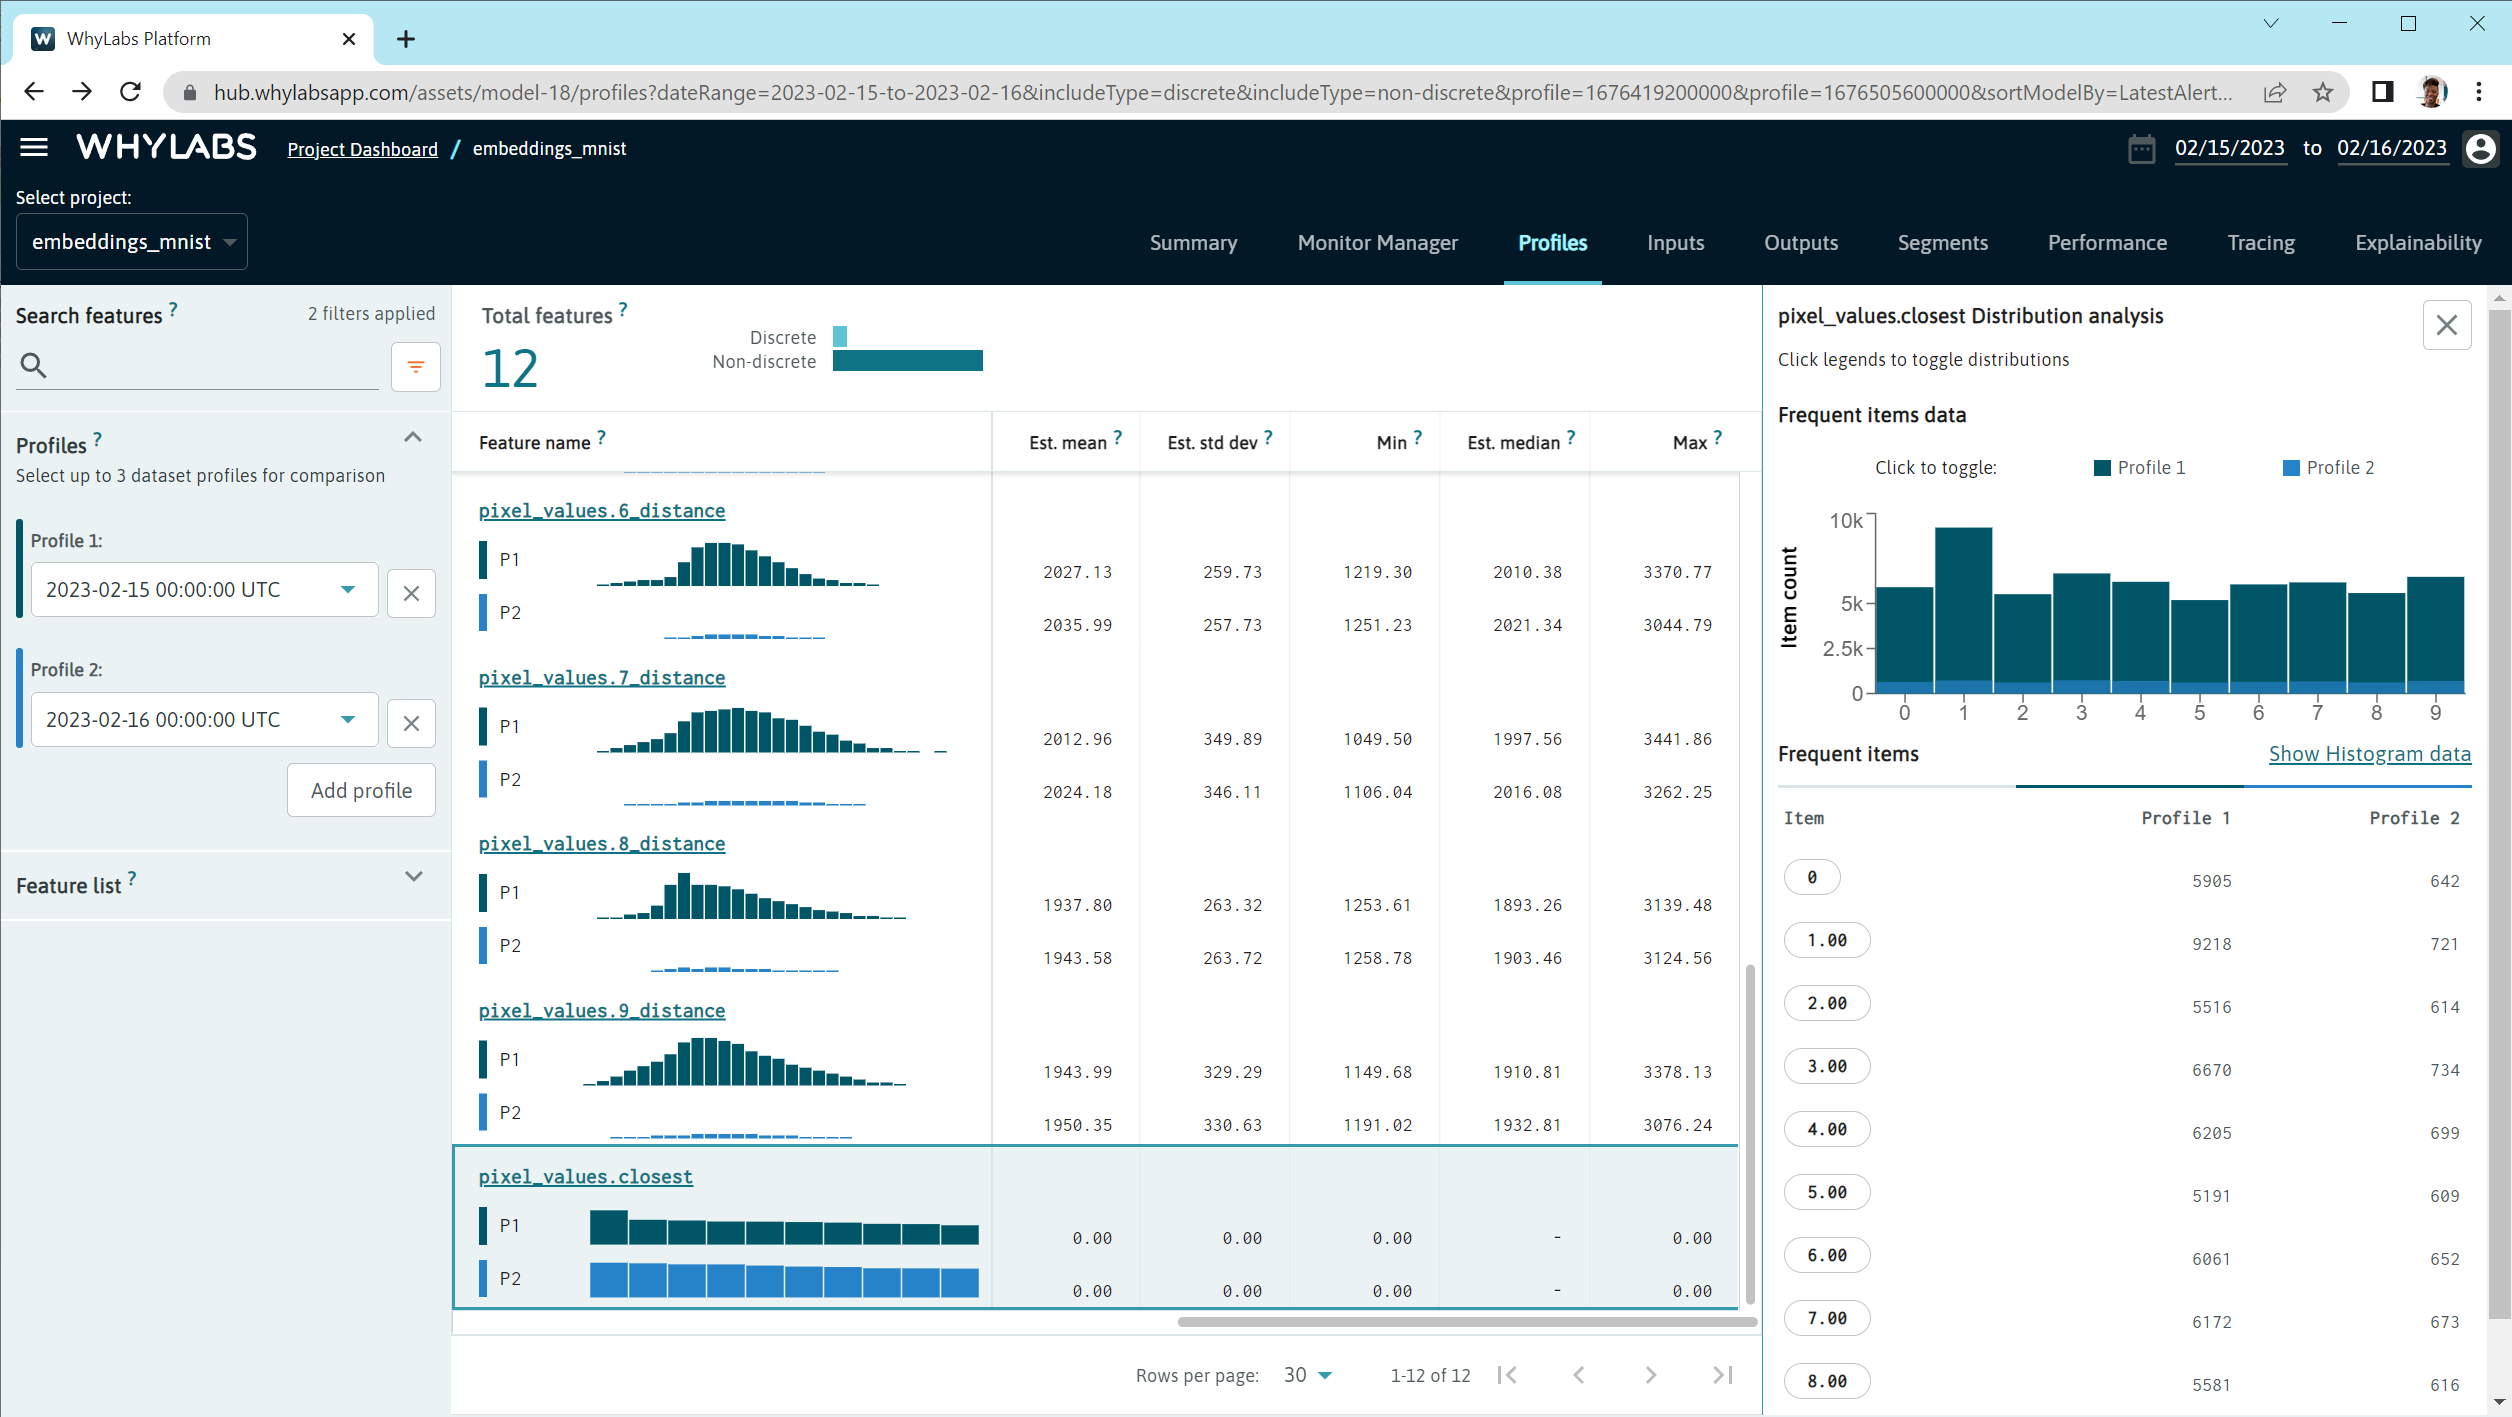
In the profile and input pages, we can see distributions of the embeddings data that tell us detailed information about the embeddings space.
Monitoring
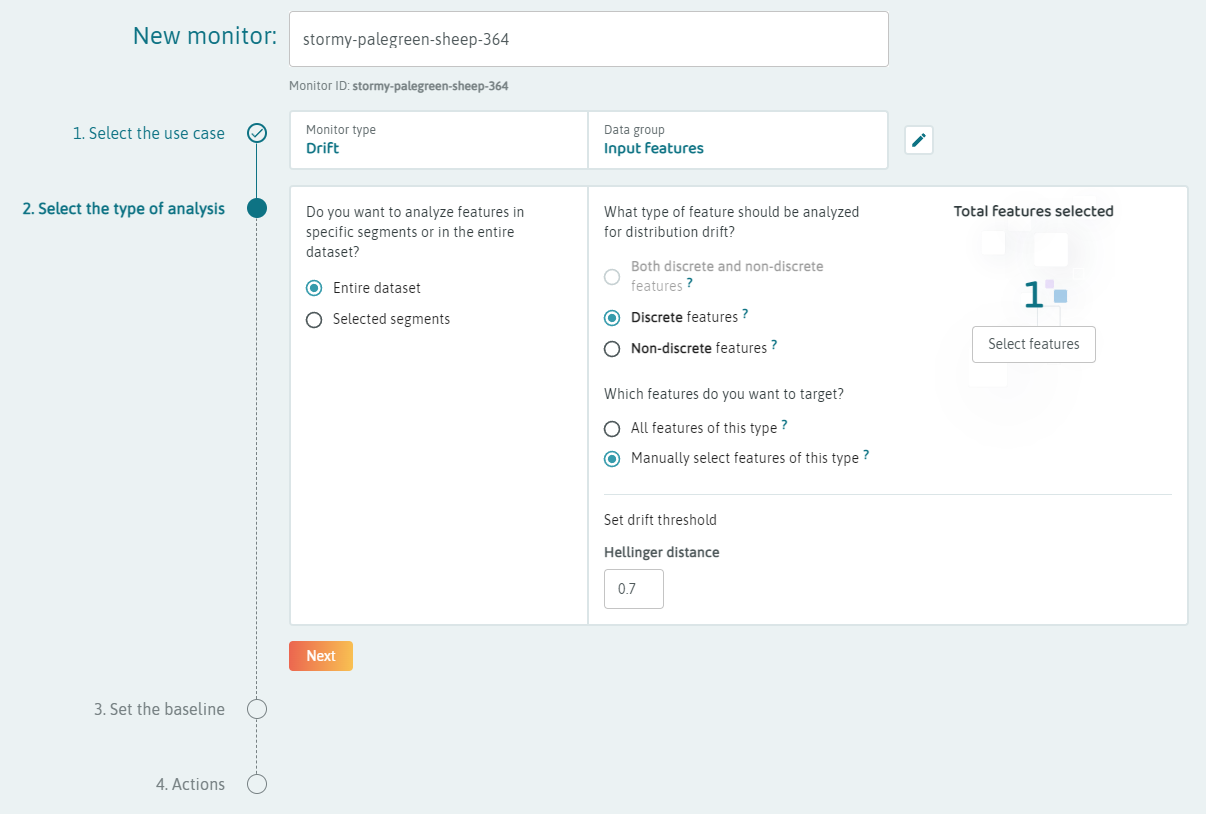
For the beta version, we may want to set several monitors for the distributions that are produced by the embeddings logging.
Set a discrete drift monitor on the FEATURE_NAME.closest feature to see overall drifts in the distribution of embeddings data.
Set continuous drift monitors on the FEATURE_NAME.REFERENCE_distance features for individual references that are of interest to monitor differences from important references.
Additional Resources
Example Notebook
Logging Generic Embeddings Data using Reference Distances
Blog Post
How to Troubleshoot Embeddings Without Eye-balling t-SNE or UMAP Plots

