whylogs Overview
What is whylogs
The WhyLabs Platform relies on statistical summaries generated by the open source whylogs library. These statistical summaries of datasets are commonly referred to as data "profiles" and capture the key information about the distributions of data within those datasets. whylogs profiles are descriptive, lightweight, and mergeable, which makes them the perfect logs for monitoring data health and model health.
After you generate whylogs profiles, you can send them to the WhyLabs Platform, which has analytics and alerting capabilities that are key to monitoring your models and pipelines in production. With the WhyLabs platform, you can monitor as many models, pipelines, datasets as you need. You can prevent all 3 types of data problems by automatically comparing newly generated profiles to their historical baselines and getting alerted if new data diverges from old data. This way, you can be confident that your model is delivering the results that you expect and run AI with certainty.
In summary with whylogs you generate summaries of datasets (called whylogs profiles) which can be used to:
- Track changes in their dataset
- Create data constraints to know whether their data looks the way it should
- Quickly visualize key summary statistics about their datasets
- Send to the WhyLabs AI Control Center for observability, monitoring, alerting, and reinforcing guardrails
These functionalities enable a variety of use cases for data scientists, machine learning engineers, and data engineers:
- Data and concept drift detection
- ML model performance degradation detection
- Exploratory data analysis via data profiling
- Tracking data for ML experiments
- Data auditing and governance
- And many more
whylogs can be run in Python or Apache Spark (both PySpark and Scala) environments on a variety of data types. We integrate with lots of other tools including Pandas, AWS Sagemaker, MLflow, Flask, Ray, RAPIDS, Apache Kafka, and more.
Python Quickstart
Installing whylogs using the pip package manager is as easy as running the following in your terminal. Note that as of May 31st, 2022 whylogs v1.x is the default version.
- whylogs v0
- whylogs v1
pip install "whylogs<1.0"
pip install whylogs
From here, you can quickly log a dataset:
- whylogs v0
- whylogs v1
from whylogs import get_or_create_session
import pandas as pd

session = get_or_create_session()

with session.logger(dataset_name="my_dataset") as logger:
    logger.log_dataframe(df)
import whylogs as why
import pandas as pd

# dataframe
df = pd.read_csv("path/to/file.csv")
results = why.log(df)
And voila, you now have a whylogs profile. To learn more about about a whylogs profile is and what you can do with it, read on.
whylogs Profiles
What are profiles
whylogs profiles are the core of the whylogs library. They capture key statistical properties of data, such as the distribution (far beyond simple mean, median, and standard deviation measures), the number of missing values, and a wide range of configurable custom metrics. By capturing these summary statistics, we are able to accurately represent the data and enable all of the use cases described in the introduction.
whylogs profiles have three properties that make them ideal for data logging: they are efficient, customizable, and mergeable.
Efficient: whylogs profiles efficiently describe the dataset that they represent. This high fidelity representation of datasets is what enables whylogs profiles to be effective snapshots of the data. They are better at capturing the characteristics of a dataset than a sample would be—as discussed in our Data Logging: Sampling versus Profiling blog post—and are very compact.
Customizable: The statistics that whylogs profiles collect are easily configured and customizable. This is useful because different data types and use cases require different metrics, and whylogs users need to be able to easily define custom trackers for those metrics. It’s the customizability of whylogs that enables our text, image, and other complex data trackers.
Mergeable: One of the most powerful features of whylogs profiles is their mergeability. Mergeability means that whylogs profiles can be combined together to form new profiles which represent the aggregate of their constituent profiles. This enables logging for distributed and streaming systems, and allows users to view aggregated data across any time granularity.
How do you generate profiles
Once whylogs is installed, it's easy to generate profiles in both Python and Java environments.
To generate a profile from a Pandas dataframe in Python, simply run:
- whylogs v0
- whylogs v1
from whylogs import get_or_create_session
import pandas as pd

session = get_or_create_session()

with session.logger(dataset_name="my_dataset") as logger:
    logger.log_dataframe(df)
import whylogs as why
import pandas as pd

# dataframe
df = pd.read_csv("path/to/file.csv")
results = why.log(df)
What can you do with profiles
Once you’ve generated whylogs profiles, a few things can be done with them:
In your local Python environment, you can set data constraints or visualize your profiles. Setting data constraints on your profiles allows you to get notified when your data don’t match your expectations, allowing you to do data unit testing and some baseline data monitoring. With the Profile Visualizer, you can visually explore your data, allowing you to understand it and ensure that your ML models are ready for production.
In addition, you can send whylogs profiles to the SaaS ML monitoring and AI observability platform WhyLabs. With WhyLabs, you can automatically set up monitoring for your machine learning models, getting notified on both data quality and data change issues (such as data drift). If you’re interested in trying out WhyLabs, check out the always free Starter edition, which allows you to experience the entire platform’s capabilities with no credit card required.
Data Constraints
Constraints are a powerful feature built on top of whylogs profiles that enable you to quickly and easily validate that your data looks the way that it should. There are numerous types of constraints that you can set on your data (that numerical data will always fall within a certain range, that text data will always be in a JSON format, etc) and, if your dataset fails to satisfy a constraint, you can fail your unit tests or your CI/CD pipeline.
To learn more about constraints, check out this notebook.
Profile Visualization
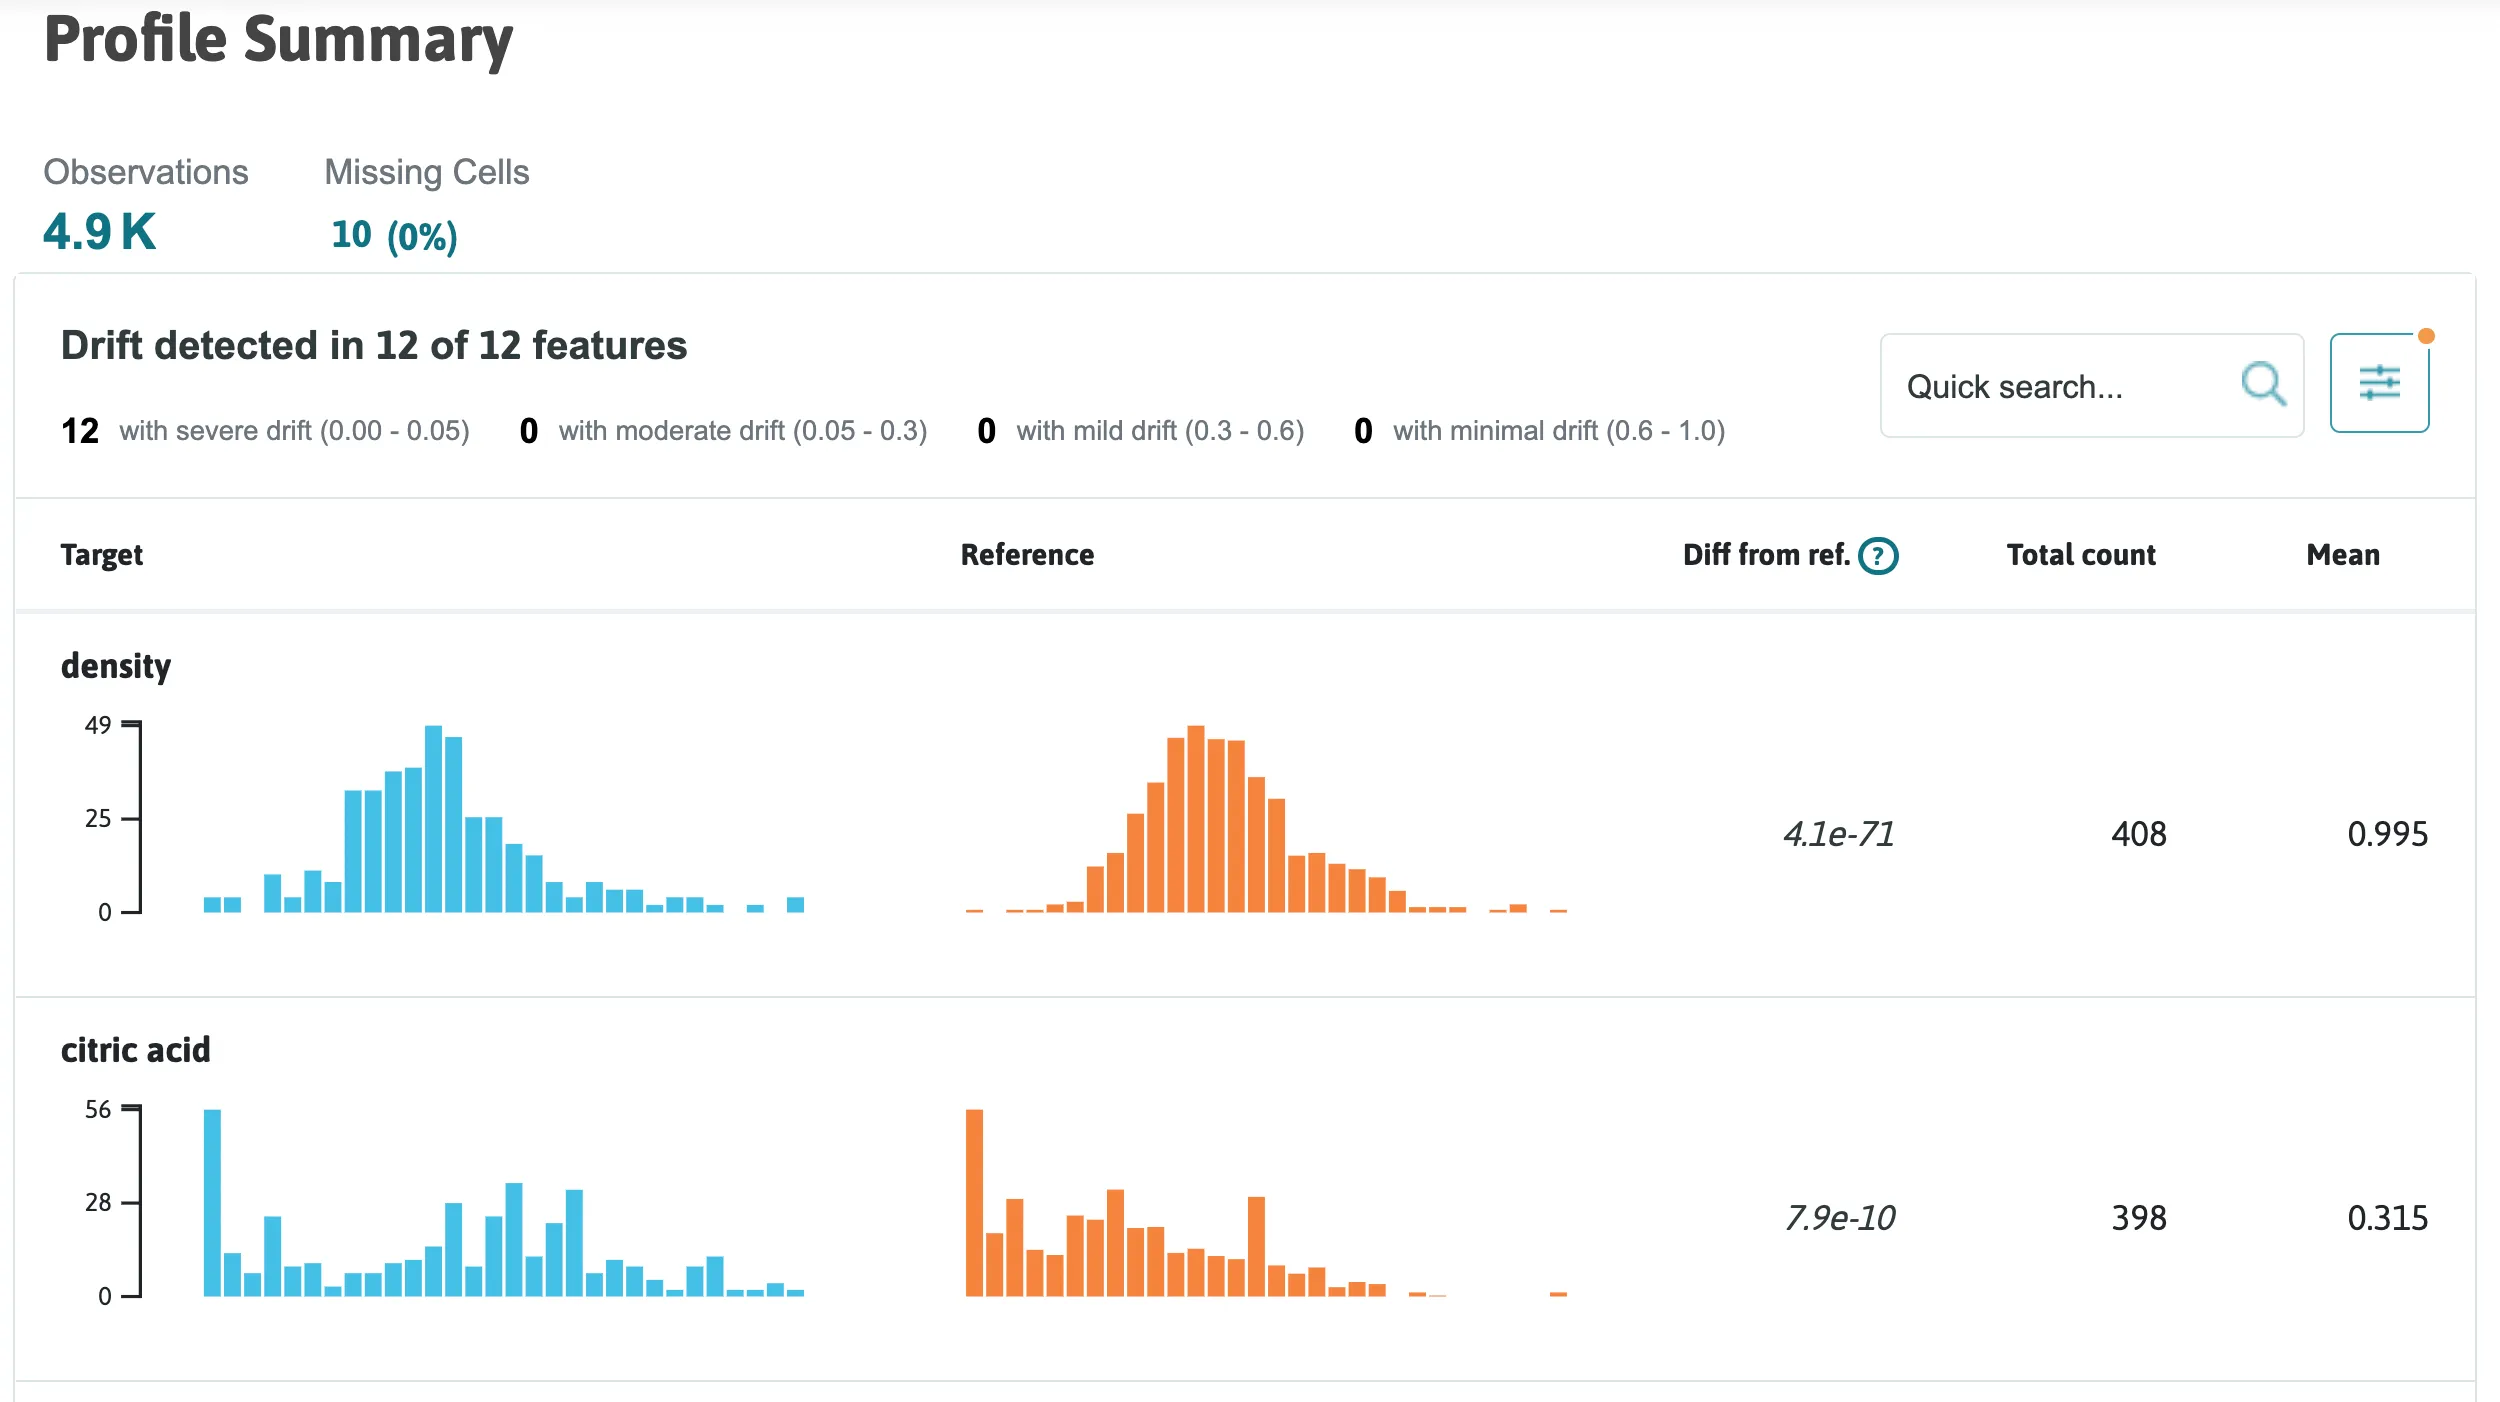
In addition to being able to automatically get notified about potential issues in data, it’s also useful to be able to inspect your data manually. With the profile visualizer, you can generate interactive reports about your profiles (either a single profile or comparing profiles against each other) directly in your Jupyter notebook environment. This enables exploratory data analysis, data drift detection, and data observability.
To access the profile visualizer, install the [viz] module of whylogs by running the following in your terminal.
pip install "whylogs[viz]"
One type of profile visualization that we can create is a drift report; here's a simple example of how to analyze the drift between two profiles:
- whylogs v0
- whylogs v1
# NotebookProfileVisualizer is not available in whylogs v0
# A browser based visualization tool for a single profile can be launched with the following.

from whylogs.viz import profile_viewer
profile_viewer()

# Users can provide a profile’s json to this tool located in the following path
# output/{dataset_name}/{session_id}/json/dataset_profile.json
import whylogs as why
result = why.log(pandas=df_target)
prof_view = result.view()

result_ref = why.log(pandas=df_reference)
prof_view_ref = result_ref.view()

from whylogs.viz import NotebookProfileVisualizer

visualization = NotebookProfileVisualizer()
visualization.set_profiles(target_profile_view=prof_view, reference_profile_view=prof_view_ref)

visualization.summary_drift_report()
To learn more about visualizing your profiles, check out this notebook.
Data Types
whylogs supports both structured and unstructured data, specifically:
| Data type | Features | Notebook Example |
|---|---|---|
| Tabular Data | ✅ | Getting started with structured data |
| Image Data | ✅ | Getting started with images |
| Text Data | ✅ | String Features |
| Embeddings | 🛠 | |
| Other Data Types | ✋ | Do you have a request for a data type that you don’t see listed here? Raise an issue or join our Slack community and make a request! We’re always happy to help |
Integrations
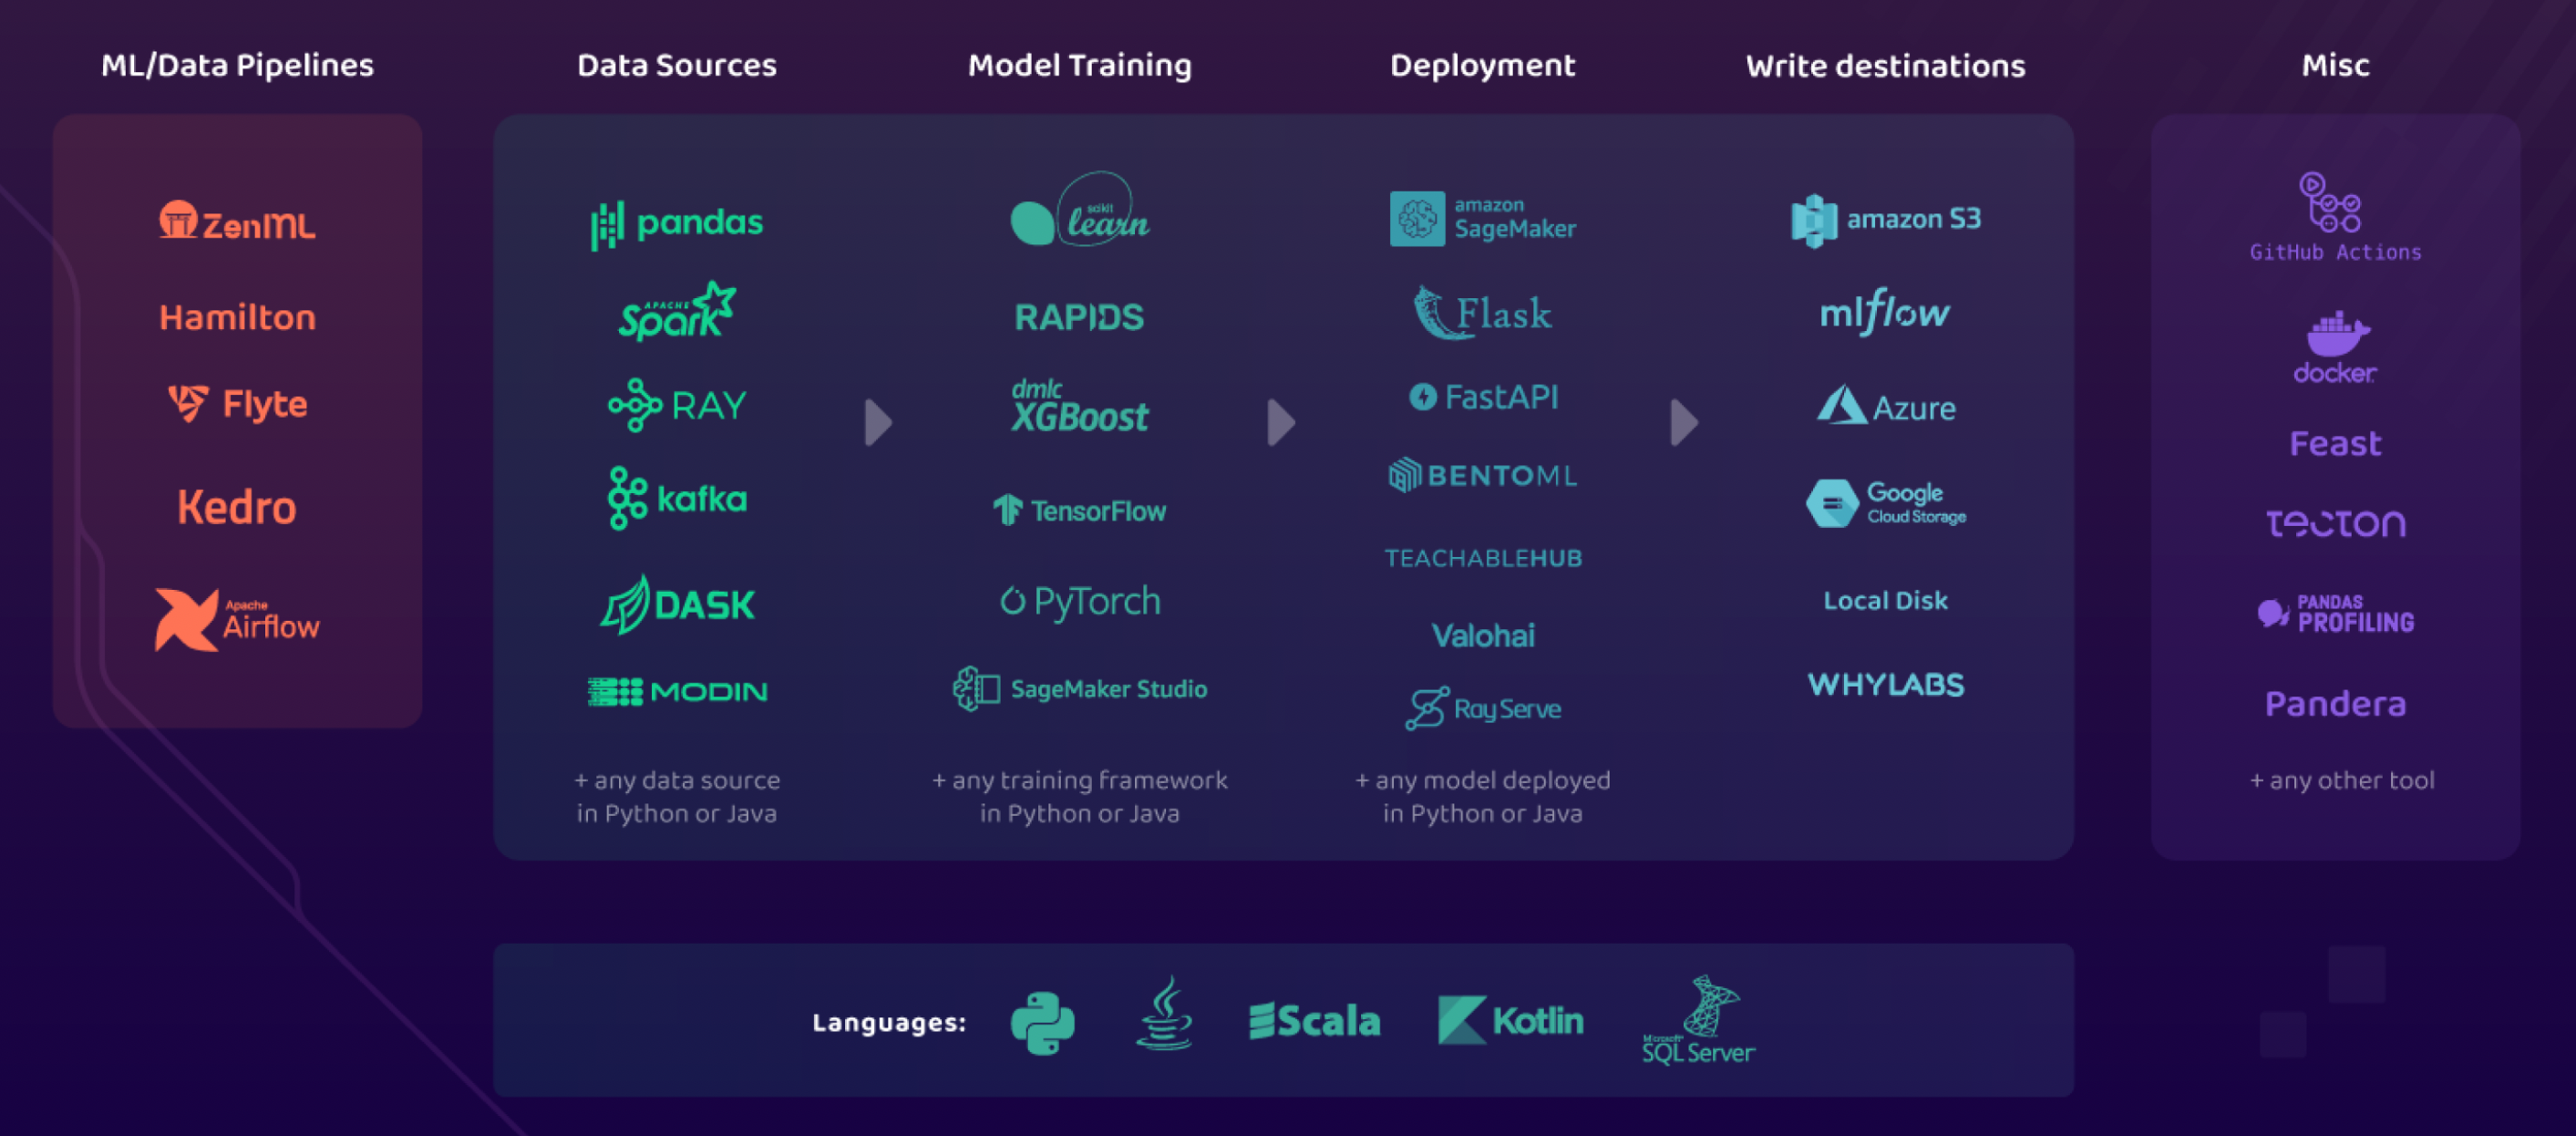
| Integration | Features | Resources |
|---|---|---|
| Spark | Run whylogs in Apache Spark environment | |
| Pandas | Log and monitor any pandas dataframe | |
| Kafka | Log and monitor Kafka topics with whylogs | |
| MLflow | Enhance MLflow metrics with whylogs: | |
| Github actions | Unit test data with whylogs and github actions | |
| RAPIDS | Use whylogs in RAPIDS environment | |
| Java | Run whylogs in Java environment | |
| Docker | Run whylogs as in Docker | |
| AWS S3 | Store whylogs profiles in S3 |
Examples
For a full set of our examples, please check out the examples folder in our Github repo.
Check out our example notebooks with Binder: ![]()
Usage Statistics
Starting with whylogs v1.0.0, whylogs collects anonymous information about a user’s environment. These usage statistics do not include any information about the user or the data that they are profiling, only the environment that the user in which the user is running whylogs.
To read more about what usage statistics whylogs collects, check out the relevant documentation.
To turn off Usage Statistics, simply set the WHYLOGS_NO_ANALYTICS environment variable to True, like so:
import os
os.environ['WHYLOGS_NO_ANALYTICS']='True'
Community
If you have any questions, comments, or just want to hang out with us, please join our Slack channel.

