Feature Walkthrough
WhyLabs Secure provides comprehensive capabilities to understand and control the behavior of GenAI applications. With Secure you can detect issues, debug problems, and protect your AI applications from potential risks and malicious actors.
The platform provides easy, one-click configuration of policy rulesets. These rulesets detect and block common LLM risks such as prompt injections and data leakage. It safeguards LLMs against misuse, bad user experience, inappropriate content—such as code and sensitive topics—and hallucinations.
Accessing WhyLabs Secure Features
To access WhyLabs Secure features, you must first:
- Sign-up for a free WhyLabs account,
- Onboard an LLM, and
- Request a free Secure trial via the platform or the WhyLabs website.
After the trial is set up, a new "LLM Secure" tab will be shown in main navigation for an LLM resource that's onboarded. This tab is then used to navigate to the "Secure" section of the platform for that LLM. The tab is only visibile for models that have been assigned the resource type "Large Language Model (LLM)" when creating the model in the platform.
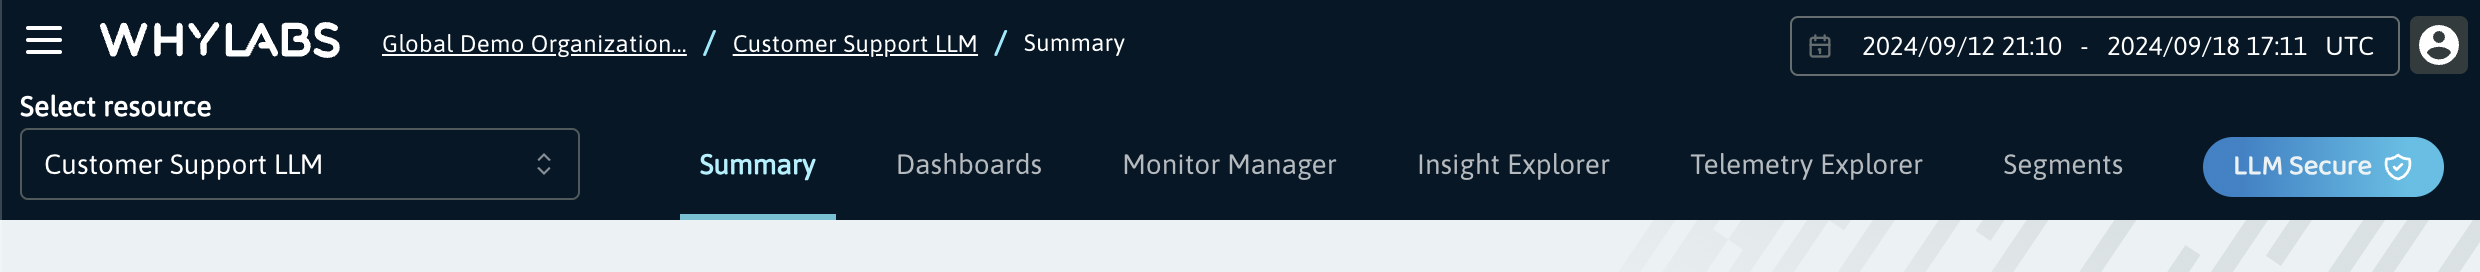 Find the "LLM Secure" tab in the navigation for any LLM that has been onboarded to WhyLabs Secure
More information on how to sign-up and onboard an LLM can be found in the Onboarding Guide
The Secure capabilities of the platform are organized into four sections:
- A Summary Dashboard with visualizations of trace and policy metrics,
- A Traces Dashboard for deeper analysis of the trace event data emitted by the AI application. Each trace has a dedicated Trace Detail View for inspection and debugging
- An Embedding Projector that allows for the visualization of the embeddings that are included in the trace data
- A Policy Dashboard where the policy rulesets can be customized to fit the required security guardrails.
Navigation, date ranges, and page-level controls
On the Secure Summary Dashboard—and on all other pages—the dark header contains controls that set the overall scope of the current dashboard. These include selectors for the model and date range, in addition to breadcrumbs to aid with wayfinding and navigation.
Beneath the header are the page-level controls. These controls are specific to the current page, although some controls are shared across all pages.
Summary Dashboard
The Summary Dashboard is the default landing page after navigating to the LLM Secure portion of the platform. Its summary visualizations can help identify anomalies and trends in the metrics for further investigation. The dashboard offers graphs and charts for:
- Total interactions with and without policy violations
- Policy activity showing the count of actions taken by the WhyLabs Guardrail
- Total tokens, including the average token count per interaction
- Average latency per interaction (below the fold, not shown)
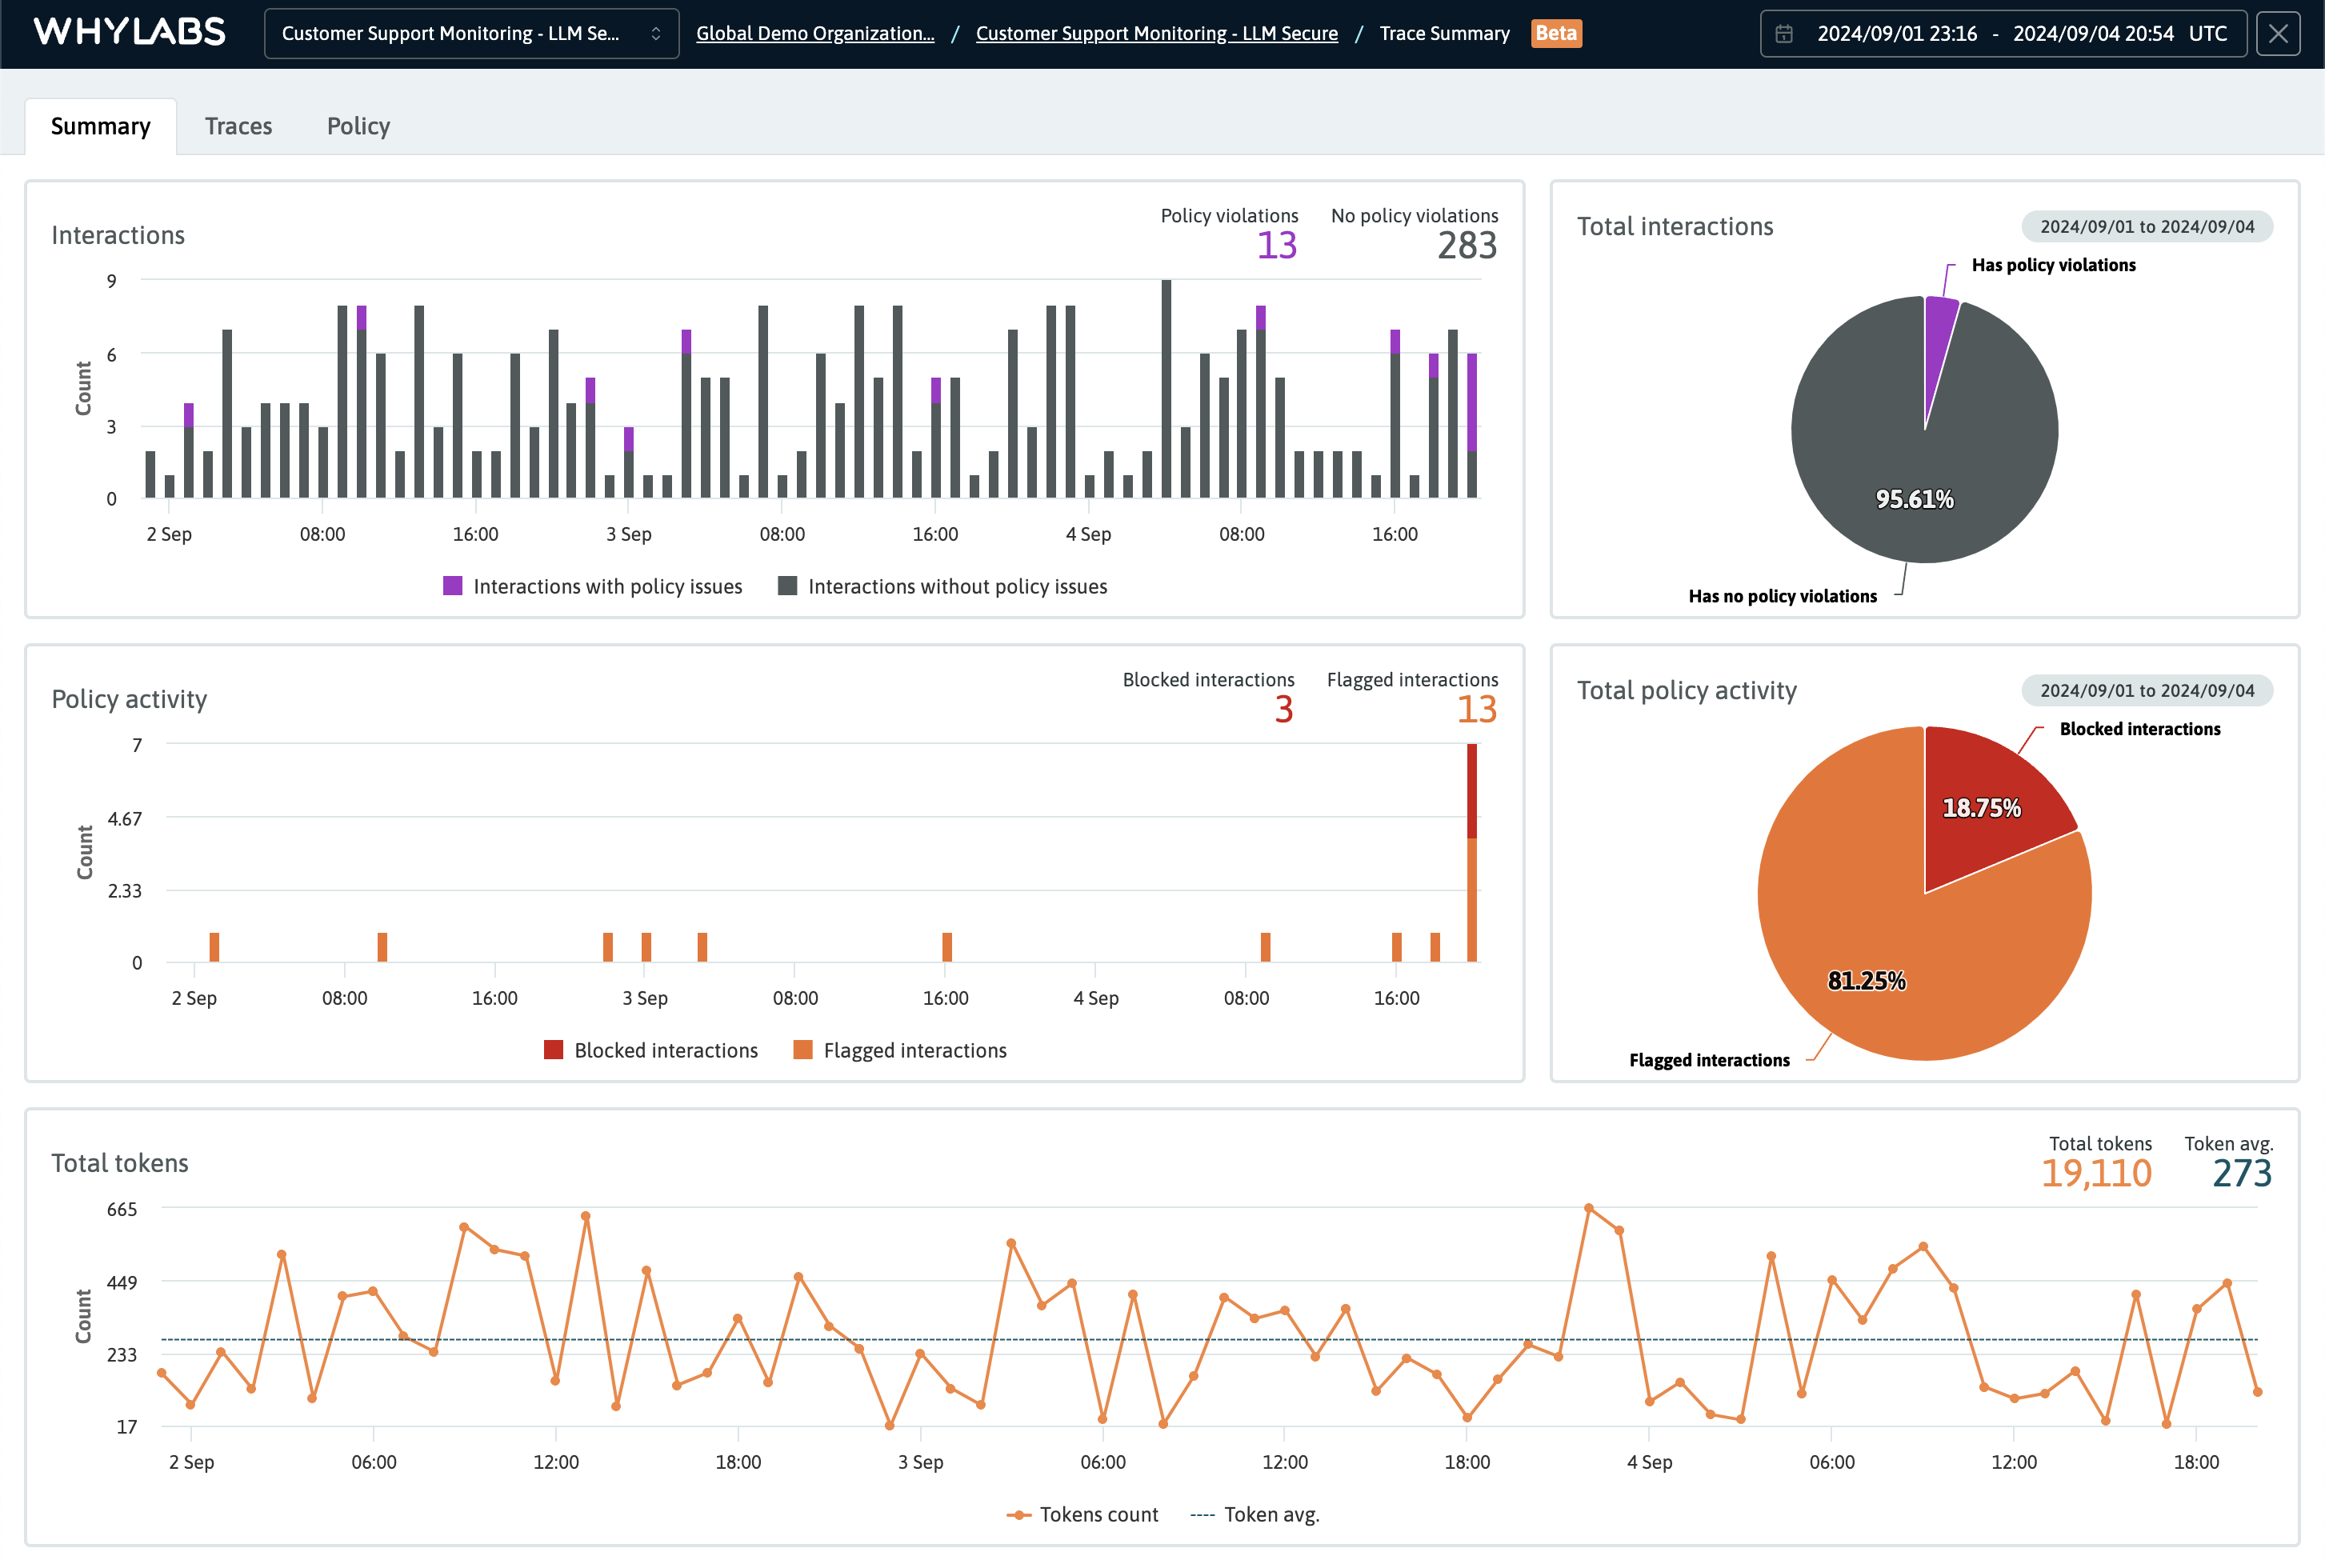 The Summary Dashboard showing the total interactions, policy activity, and total tokens for a specific time range
Traces Dashboard
Traces can be filtered by time ranges and analyzed as needed. Additional filters are provided for other dimensions including: tags type, latencies, model versions, and IDs.
The page-level controls for the Traces Dashboards, include the ability to filter traces by various useful dimensions including by violation tags, total policy violations, and total trace latency. The trace lineage is also displayed under the header, which provides an easy way to scope the list of traces to a time range inclusive of the oldest to the newest trace.
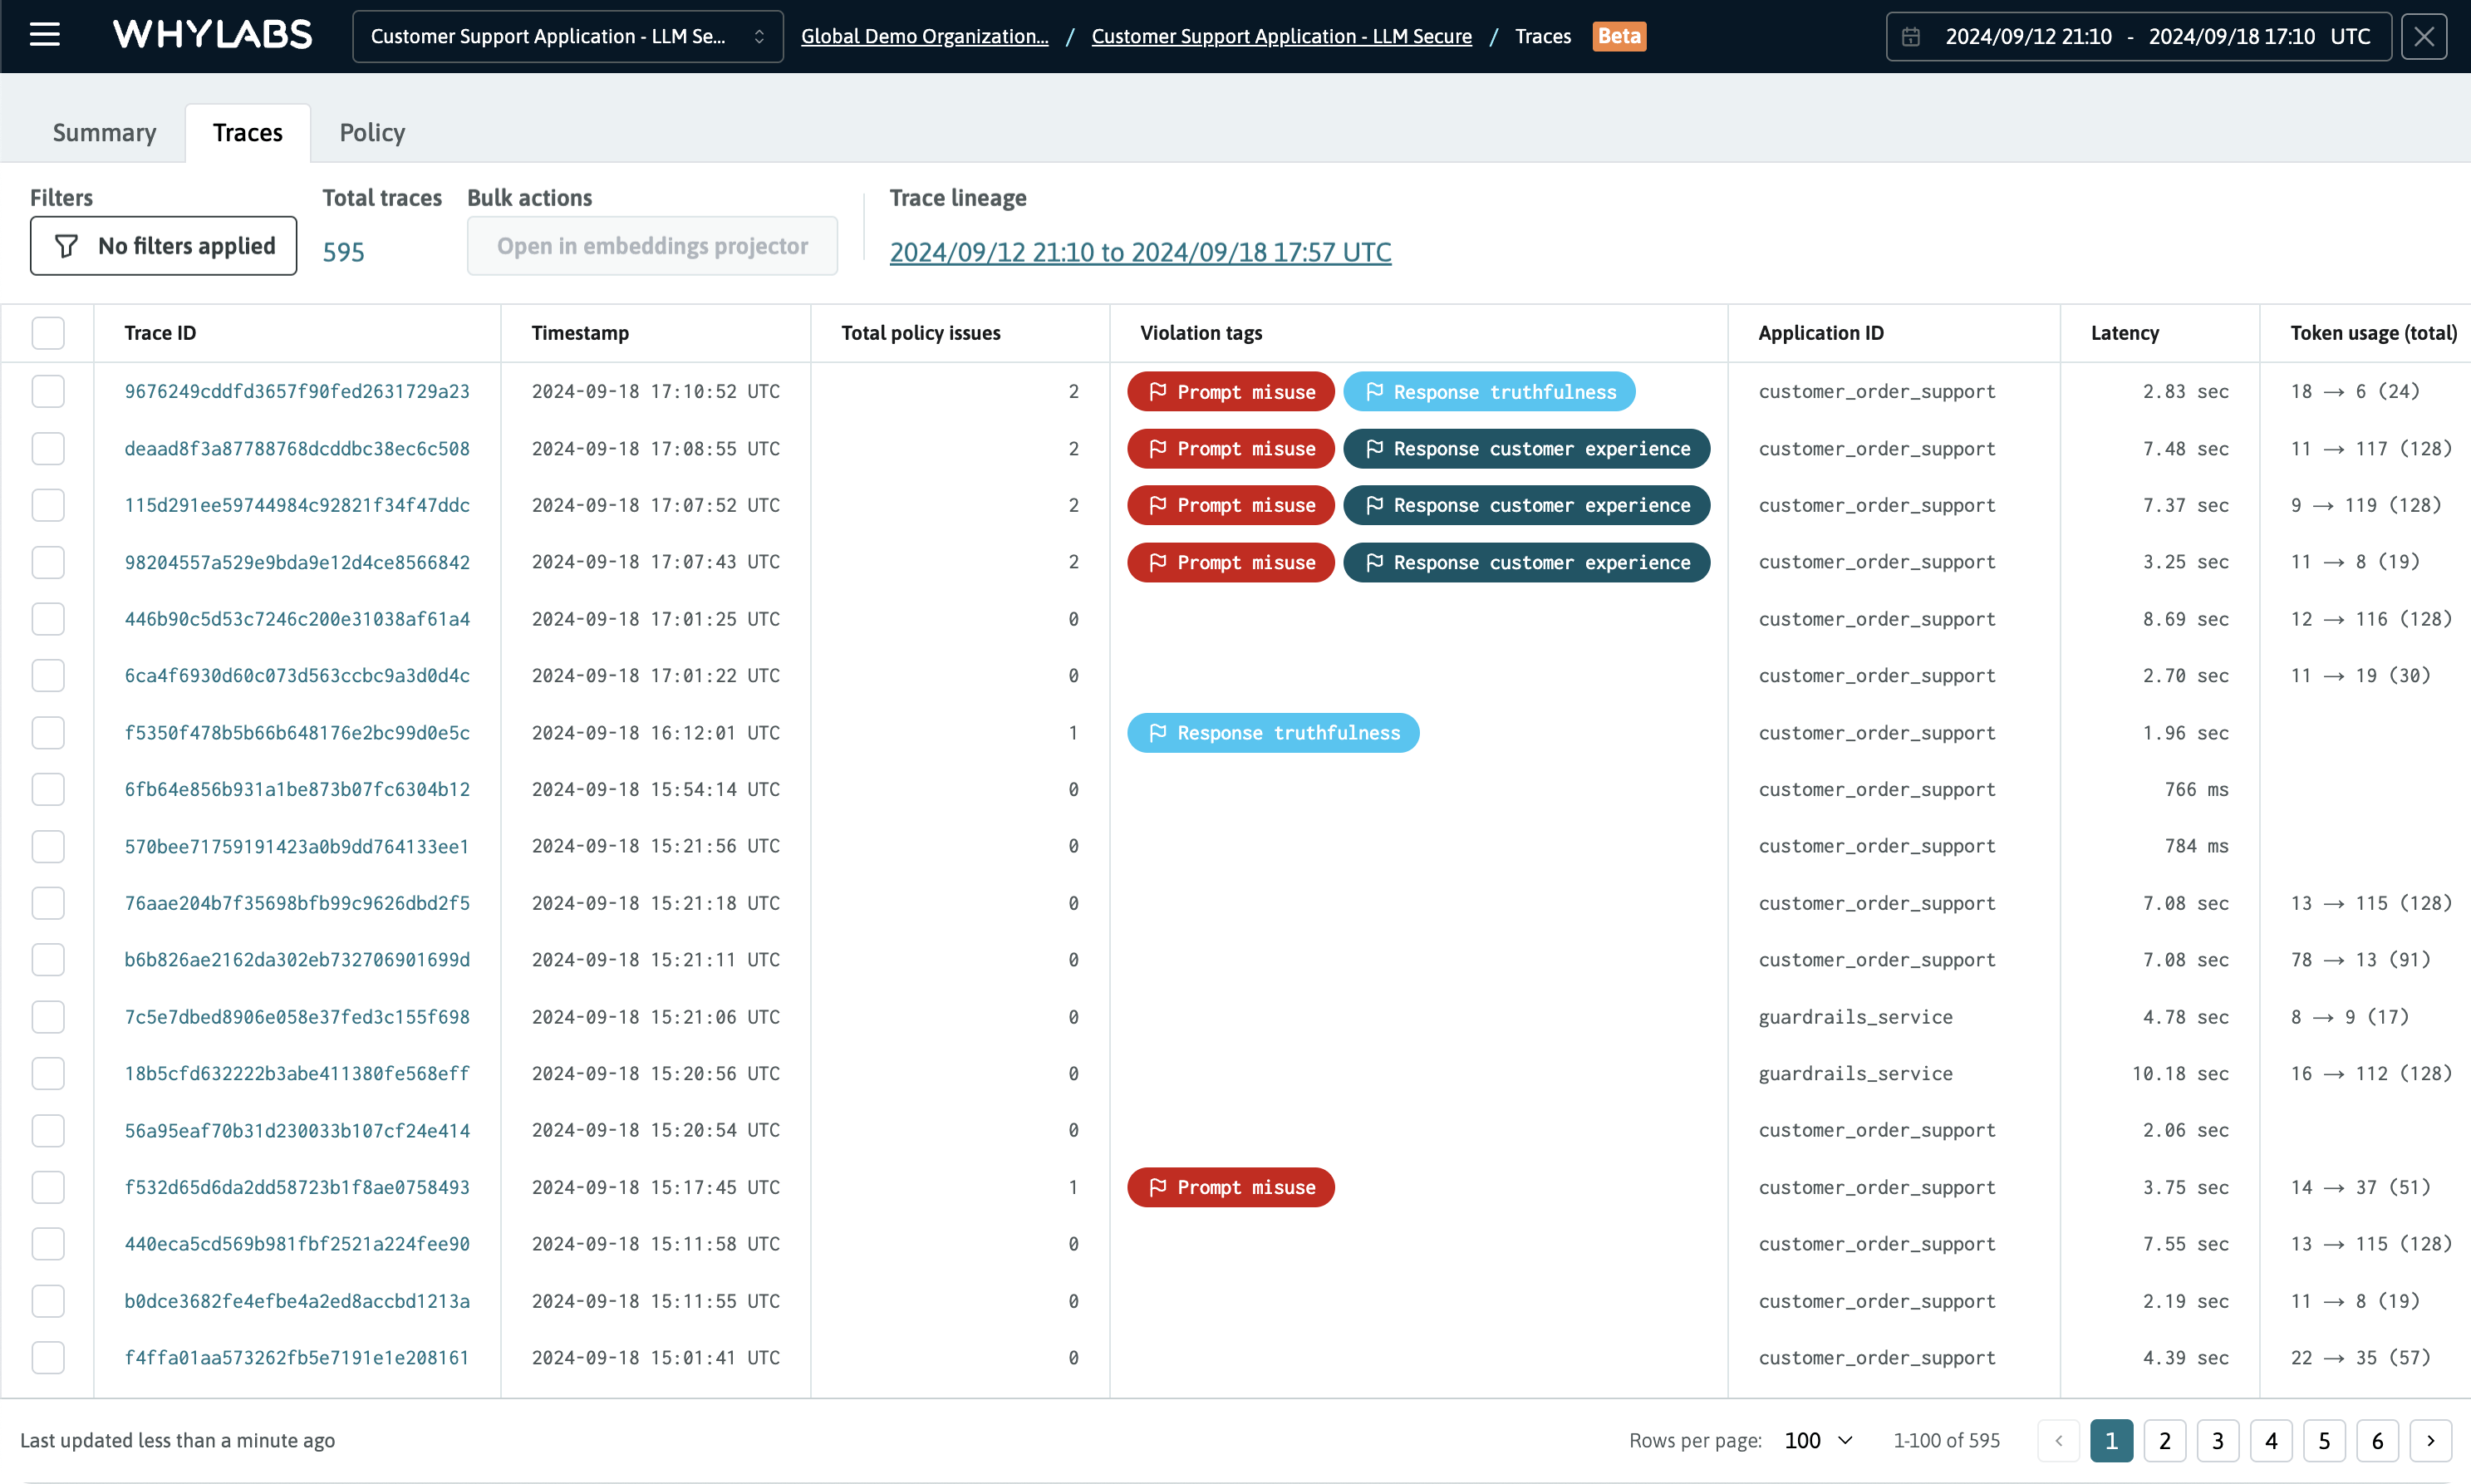 The Traces Dashboard showing the list of traces scoped to a specific time range, with no additional filters applied
Custom filters
The trace list can be filtered by the following dimensions:
- Trace ID: Filter by a specific ID
- Total policy violations: Filter by the total number of violation that occurred
- Violations tags: Filter by the type of violation that occurred
- Latency: Filter by a particular latency threshold
- Token usage: Filter by the total token count
Additional filters can be added to create a multi-condition filter. For example, you can filter by a specific number of violations and by a specific violation tag. Violation tags also include either a flag or blocked icon, indicating the type of action that was taken by the guardrail.
Clicking on a trace will open its Trace Detail View.
Trace Details
Traces allow for inspection and debugging of event data emitted by GenAI applications. The Trace Detail view provides a way to easily identify and address potential issues with the application from inspecting the attributes and telemetry data included in its spans.
After clicking on a trace, an overlay will appear that provides a waterfall visualization of the trace/span event data. Spans are titled based on the type of event they represent, such as intereactions, RAG context steps, guardrail actions, and completions.
When viewing trace details, simply click on a span to inspect its event and attribute data.
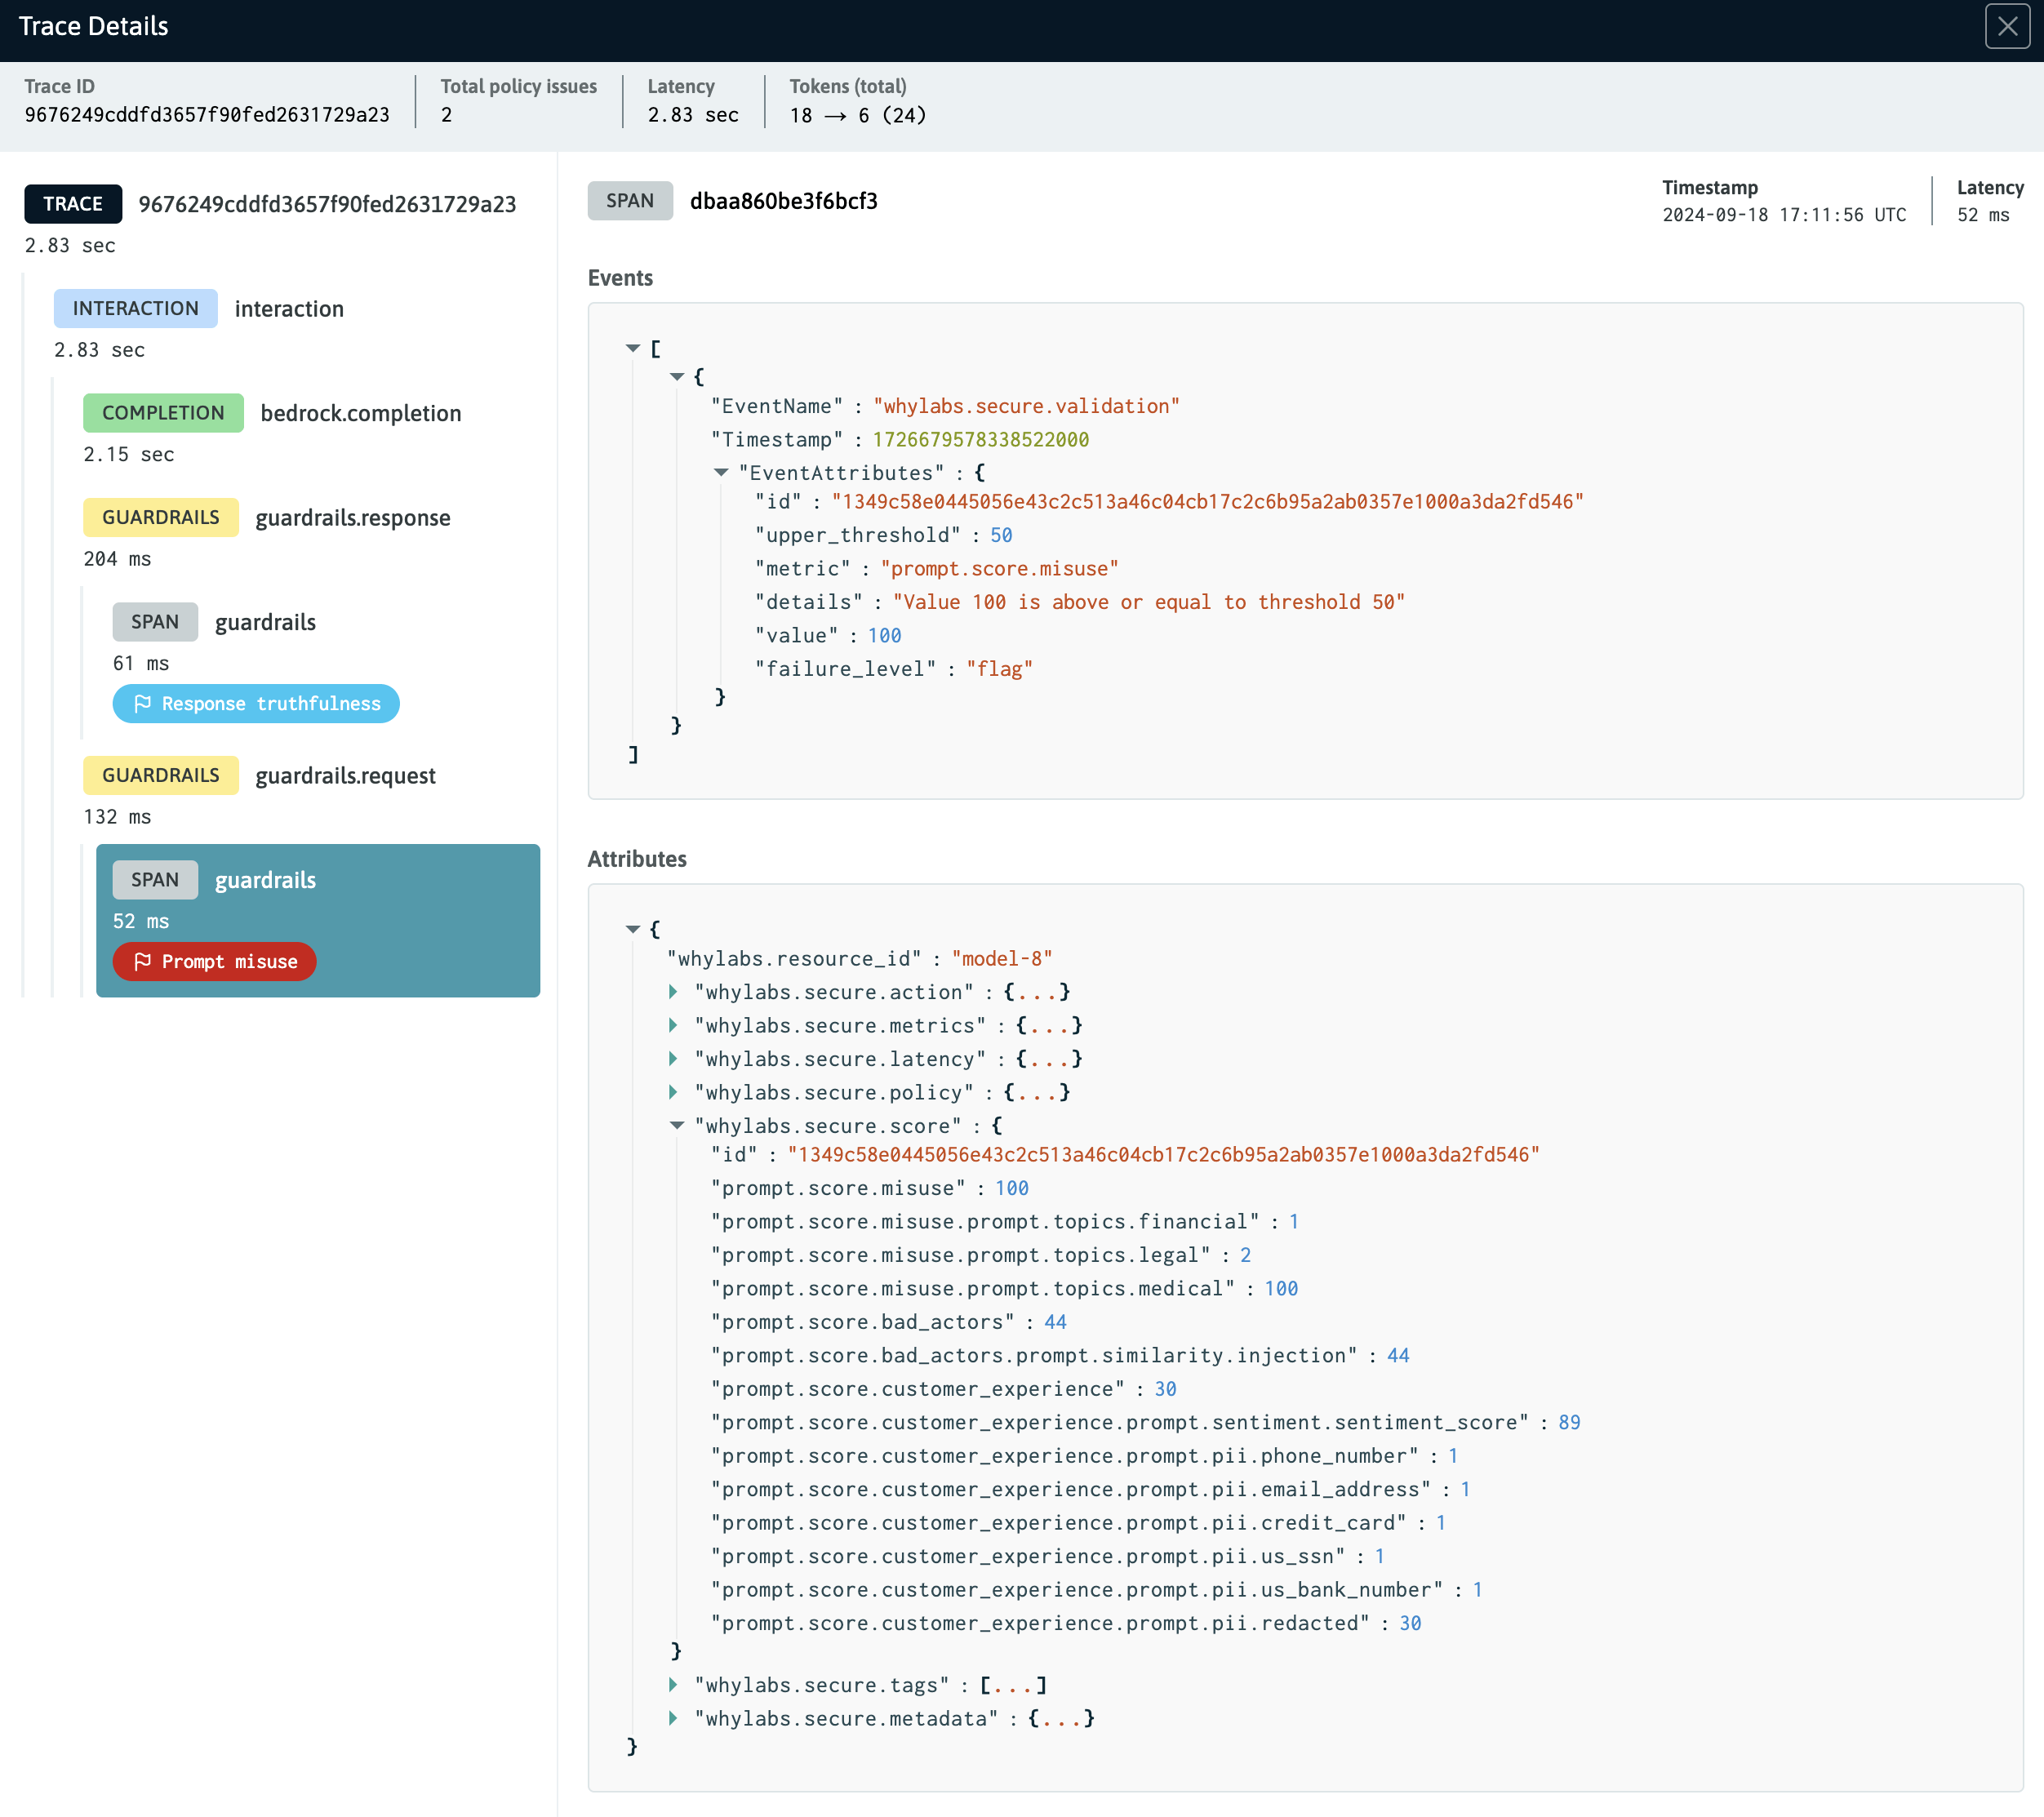 The Trace Detail View showing the a guardrail span selected for inspection
Embeddings Projector
An interactive, 3D scatter plot is included in WhyLabs Secure. The visualization is refered to as the "Embeddings Projector" in the platform and it is used for visualizing embeddings alongside samples from WhyLabs guardrail datasets. As such, the projector provides a powerful tool to aid with debugging after policy violations have occurred, and it can help build a better understanding of the guardrails performance.
Reducing dimensionality for visualization
Traces typically contain multiple spans that relate to events that occur in the AI application. For spans that include embeddings, WhyLabs uses the Principal Component Analysis (PCA) dimensionality reduction technique to calculate 3D coordinates for each embedding. The PCA coordinates are used to render the embeddings in the projector's 3D space. Additionally, metadata about the embeddings is passed into the projector to improve the interpretability of the visualization.
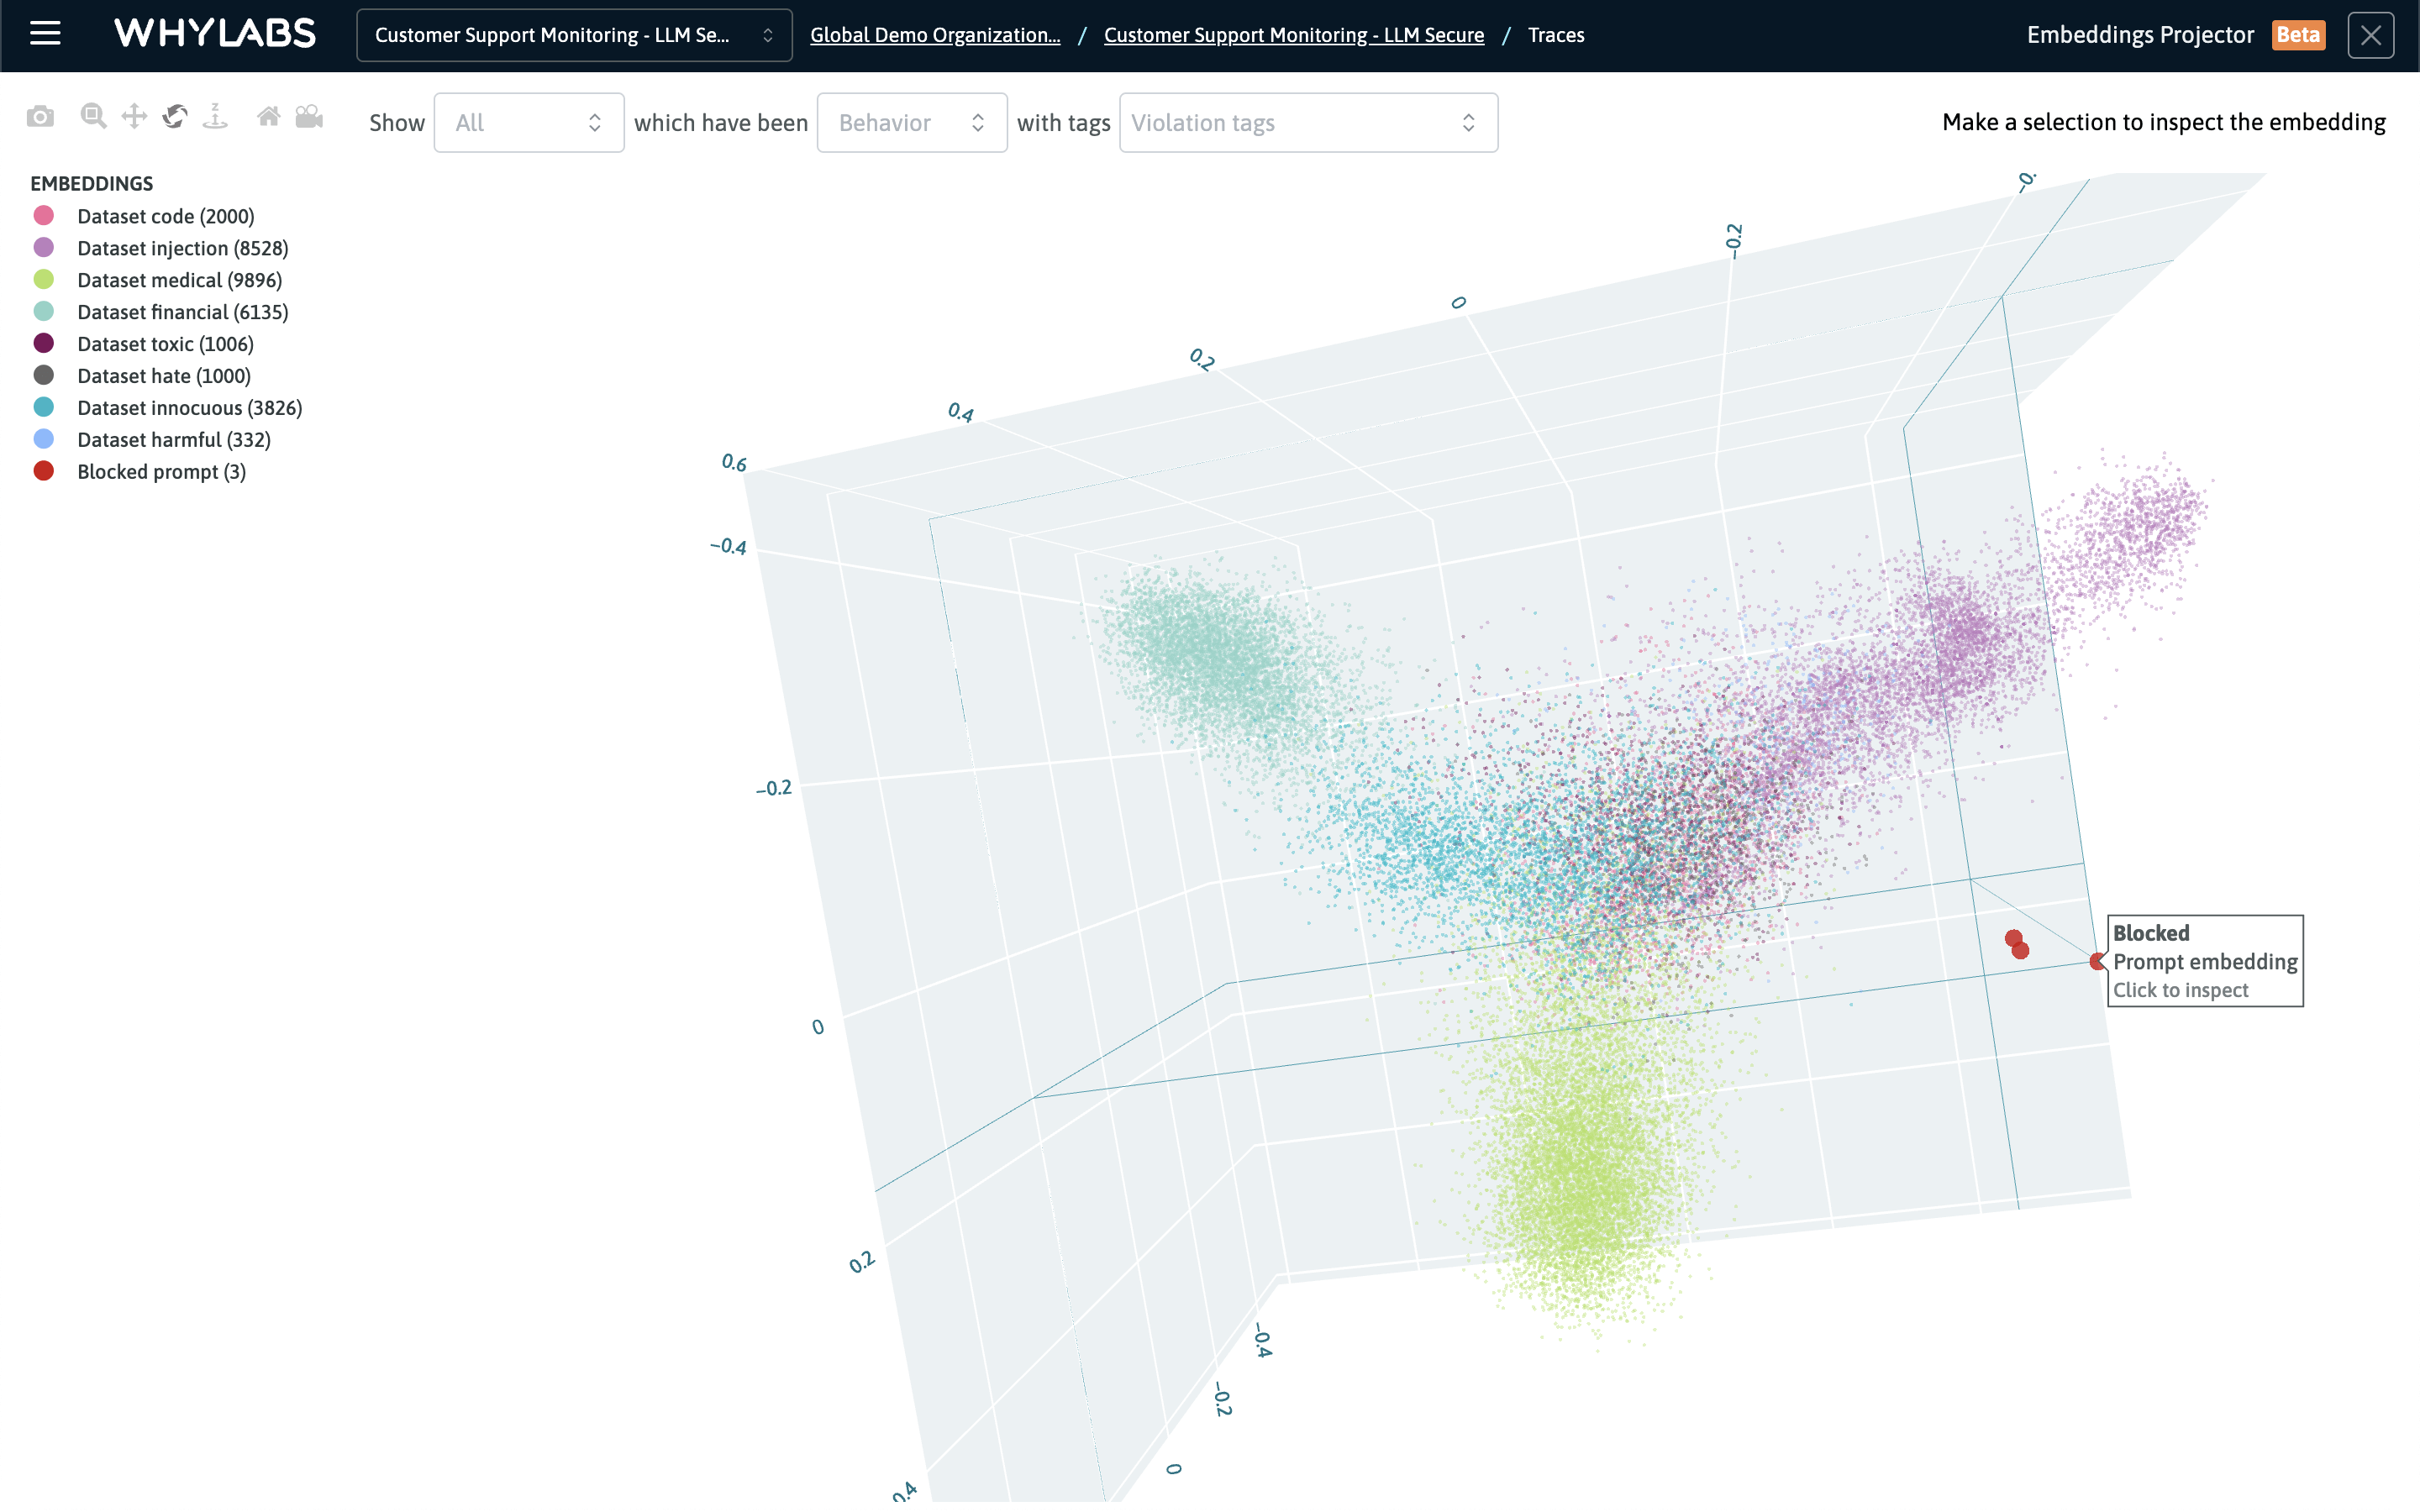 The embeddings projector is an interactive, 3D scatter plot. This screen visualizes clusters for various guardrail datasets and three blocked prompts
Loading embeddings into the projection space
Embeddings must be selected from the Traces Dashboard in order to load them into the projector for visualization. To make this process easy, a multi-select option for traces has been provided. All embeddings found in the spans for each selected trace will be loaded into the projector.
The filters can be used to refine the list of traces to just those traces that warrant investigation and debugging. After selecting the traces, click the "Open in embeddings projector" button to launch the projector (see below).
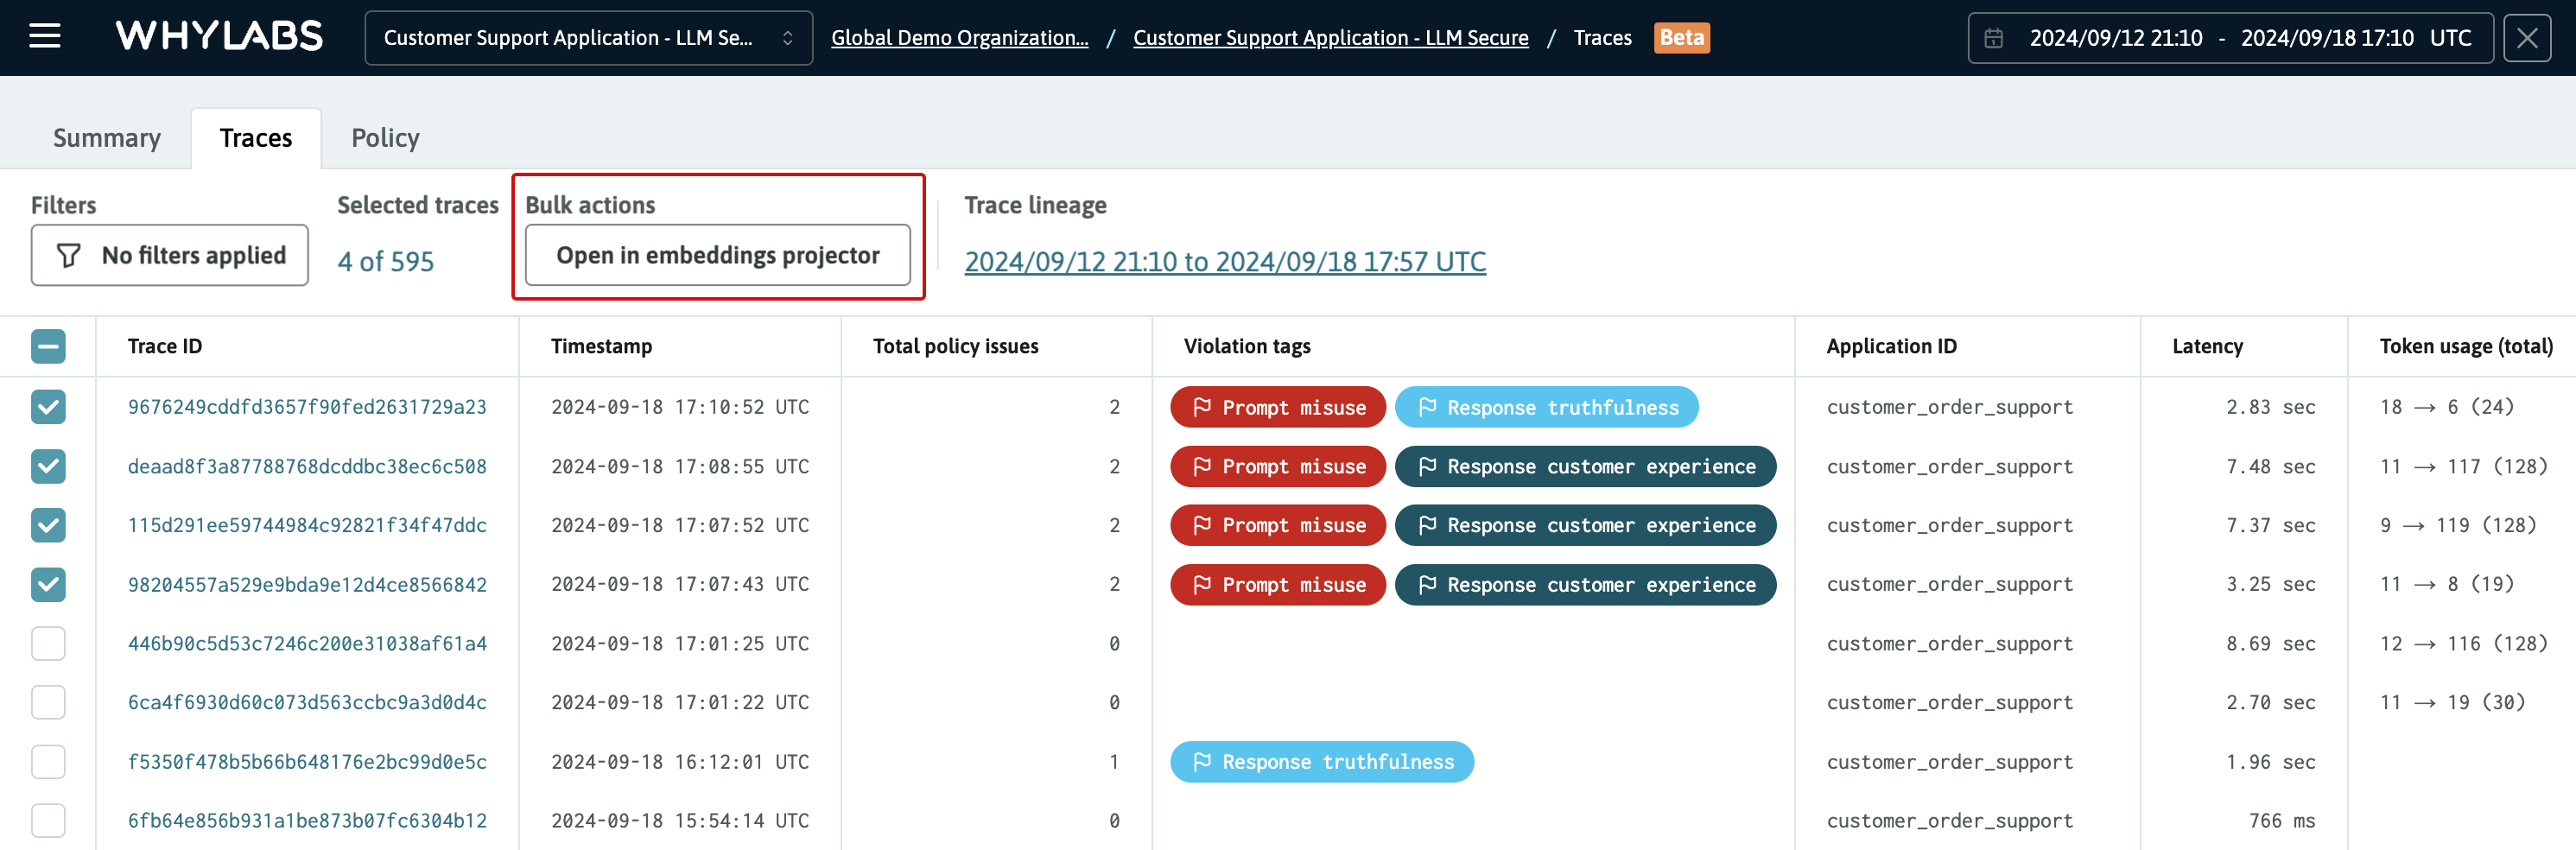 Four traces are selected for viewing in the embeddings projector
Controls and custom filters
Controls to adjust the position of the 3D space are located in the top left corner of the interface. To the right of the controls are the filters that can be used to refine the view of the embeddings in the projector. It's possible to filter the view based on the following parameters:
- Type of embedding: prompt, response, or both
- Guardrail behavior: blocked, flagged, or observed
- Violation tags: the type of violation that occurred
Legends are provided to the left of the 3D scatter plot help identify the different guardrail datasets that are displayed as clusters, in addtion to legends for the embeddings that were selected for viewing.
A combination of shape and color encodings are used to differentiate the embeddings:
- Cirles represent prompts
- Squares represent responses
- Red indicates a blocked prompt or response
- Orange indicates a flagged prompt or response
- Blue indicates an observed prompt or response
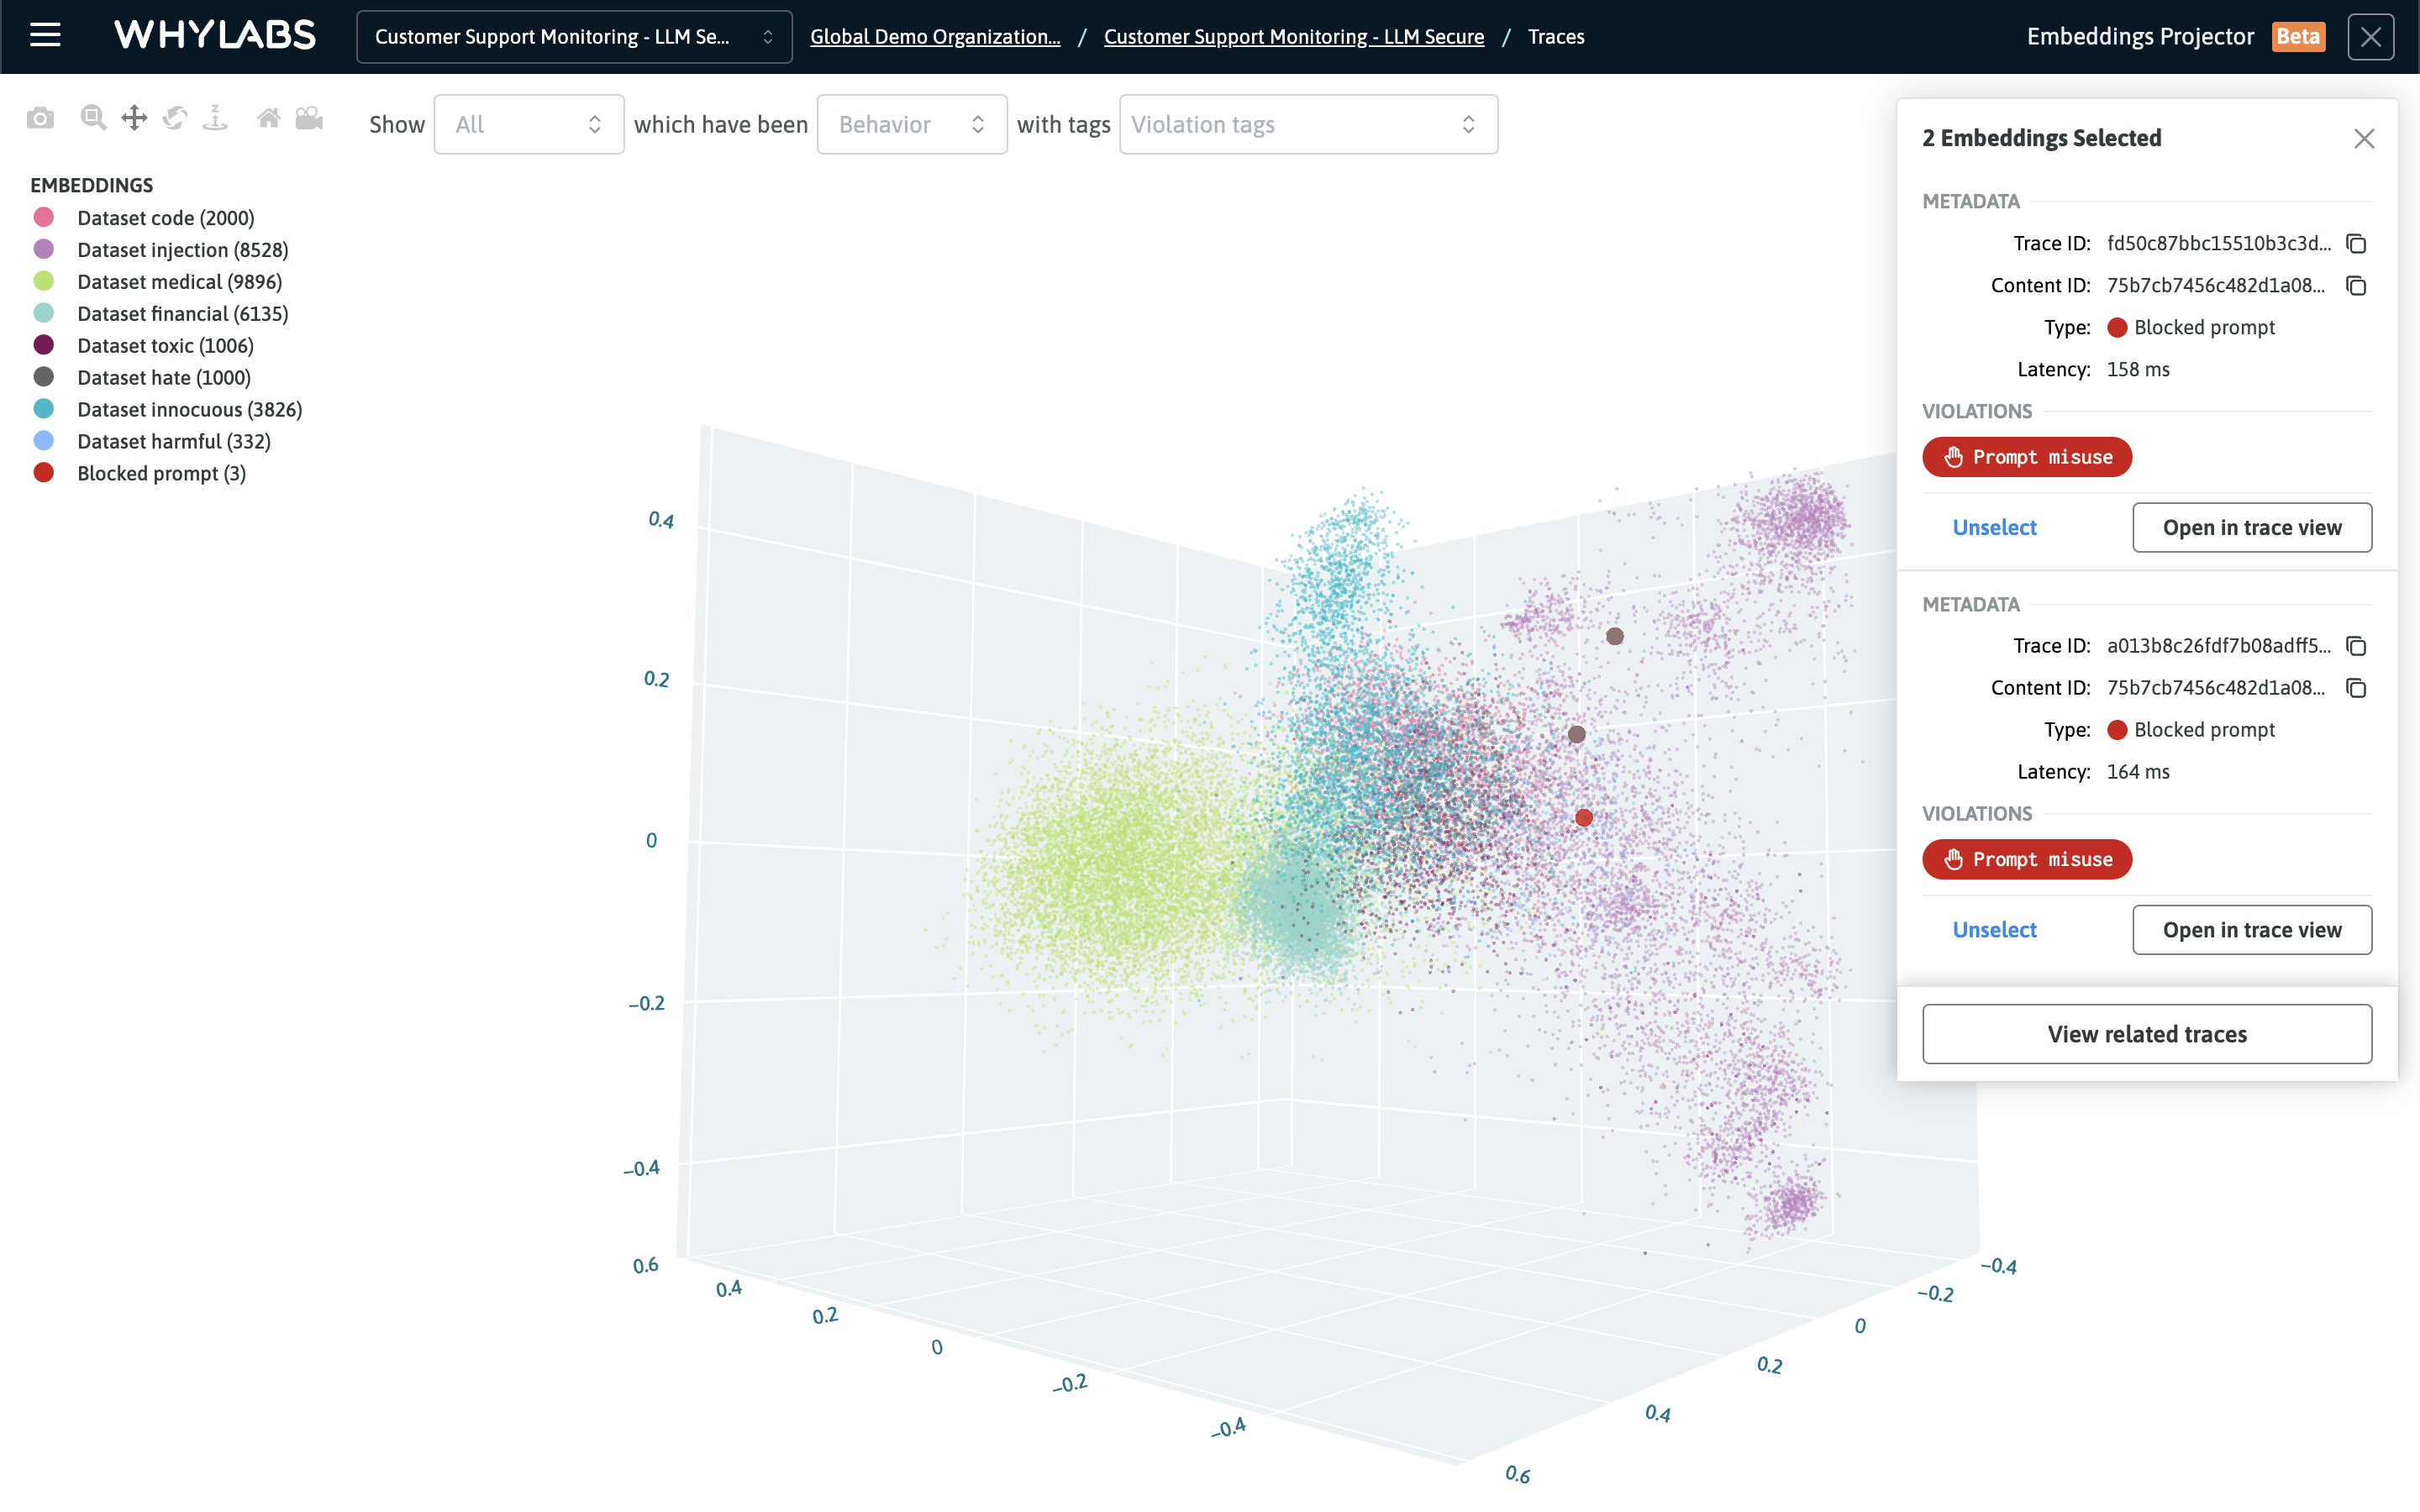 Embeddings can be selected to inspect their metadata and link back to the original trace for debugging purposes
Policy Dashboard
WhyLabs Secure provides five policy rulesets that can each be enabled in one click via the Policy dashboard. They offer a comprehensive set of guardrails for operating LLM applications securely. The rulesets are based on the MITRE ATLAS and LLM OWASP standards, and are designed to provide fine-grained control over the behavior of the AI application.
The rulesets cover the following important risk categories:
- Bad actors ruleset: detects prompts that include malicious actors or that indicate malicious usage
- Misuse ruleset: detects prompts or responses that include non-compliant or sensitive topics, or that suggest poor usage
- Cost ruleset: detects statistical outliers that correlate to cost including token count and character count
- Customer Experience ruleset: detects interactions that indicate the user had a poor customer experience with the AI application
- Truthfulness ruleset: detects hallucinations, errors, and ambiguous responses that can result in overreliance.
Each ruleset provides controls to either observe, flag, or block interactions that have violated the policy's settings. Each ruleset also provides a sensitivity configuration and additional options based on the ruleset. For example, it's possible to include specific topics that should be detected for the Misuse ruleset.
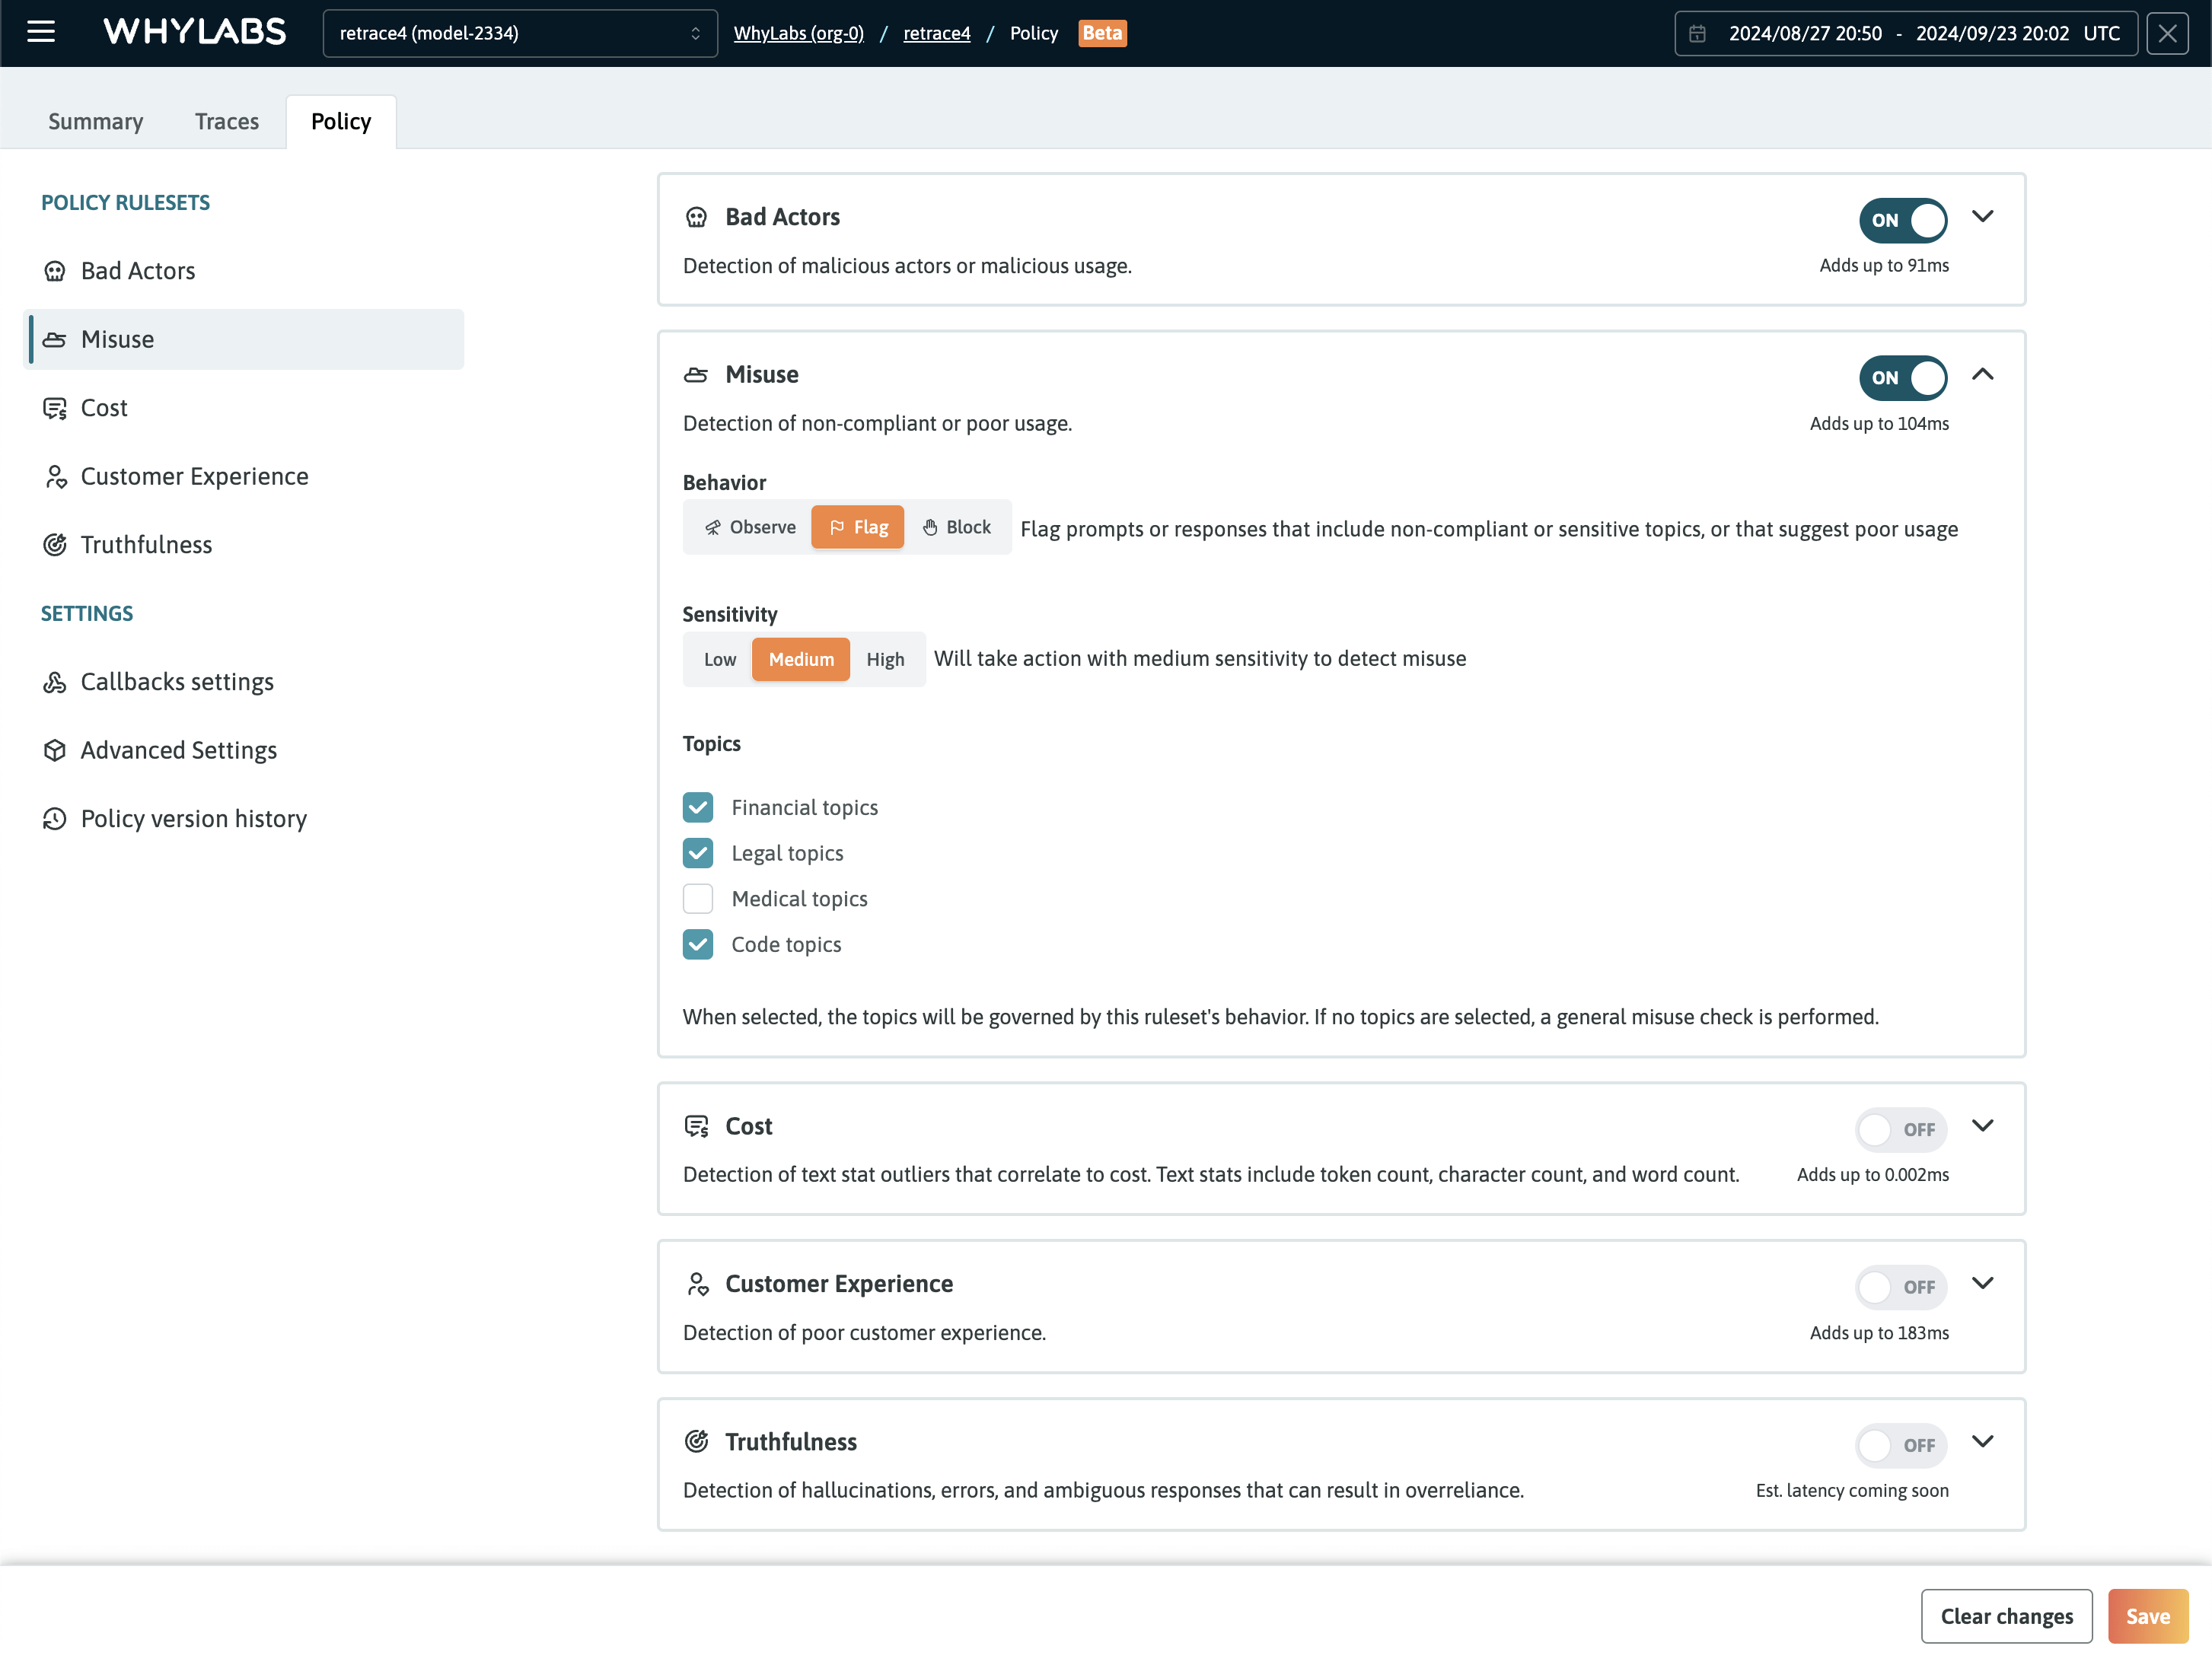 The Policy Dashboard showing the five rulesets that can be enabled with one click

