Dashboards
Overview of Dashboard Use Cases
Dashboards are core to the AI Observatory user workflows. Each dashboard is designed with specific use case and user in mind:
- Organization dashboard:
- An overview of all models that belong to an organization
- typically used for reporting model health at weekly and monthly business review / operations meetings
- Model summary dashboard:
- An overview of all health metrics of one specific model, including inputs data quality and drift, output concept drift, performance metrics, and data ingestion metrics
- Typically used by data scientists and SREs who are responsible for operating the model
- Performance dashboards:
- An overview of all performance metrics tracked for a specific model
- Typically used by data scientists and product managers who are operating the product
Organization Dashboard
The organization dashboard will be the starting point of your app experience, unless you navigate into the app using a specific url. The organization dashboard shows all models that are tracked by the organization and gives a high level summary of the core insights into each model.
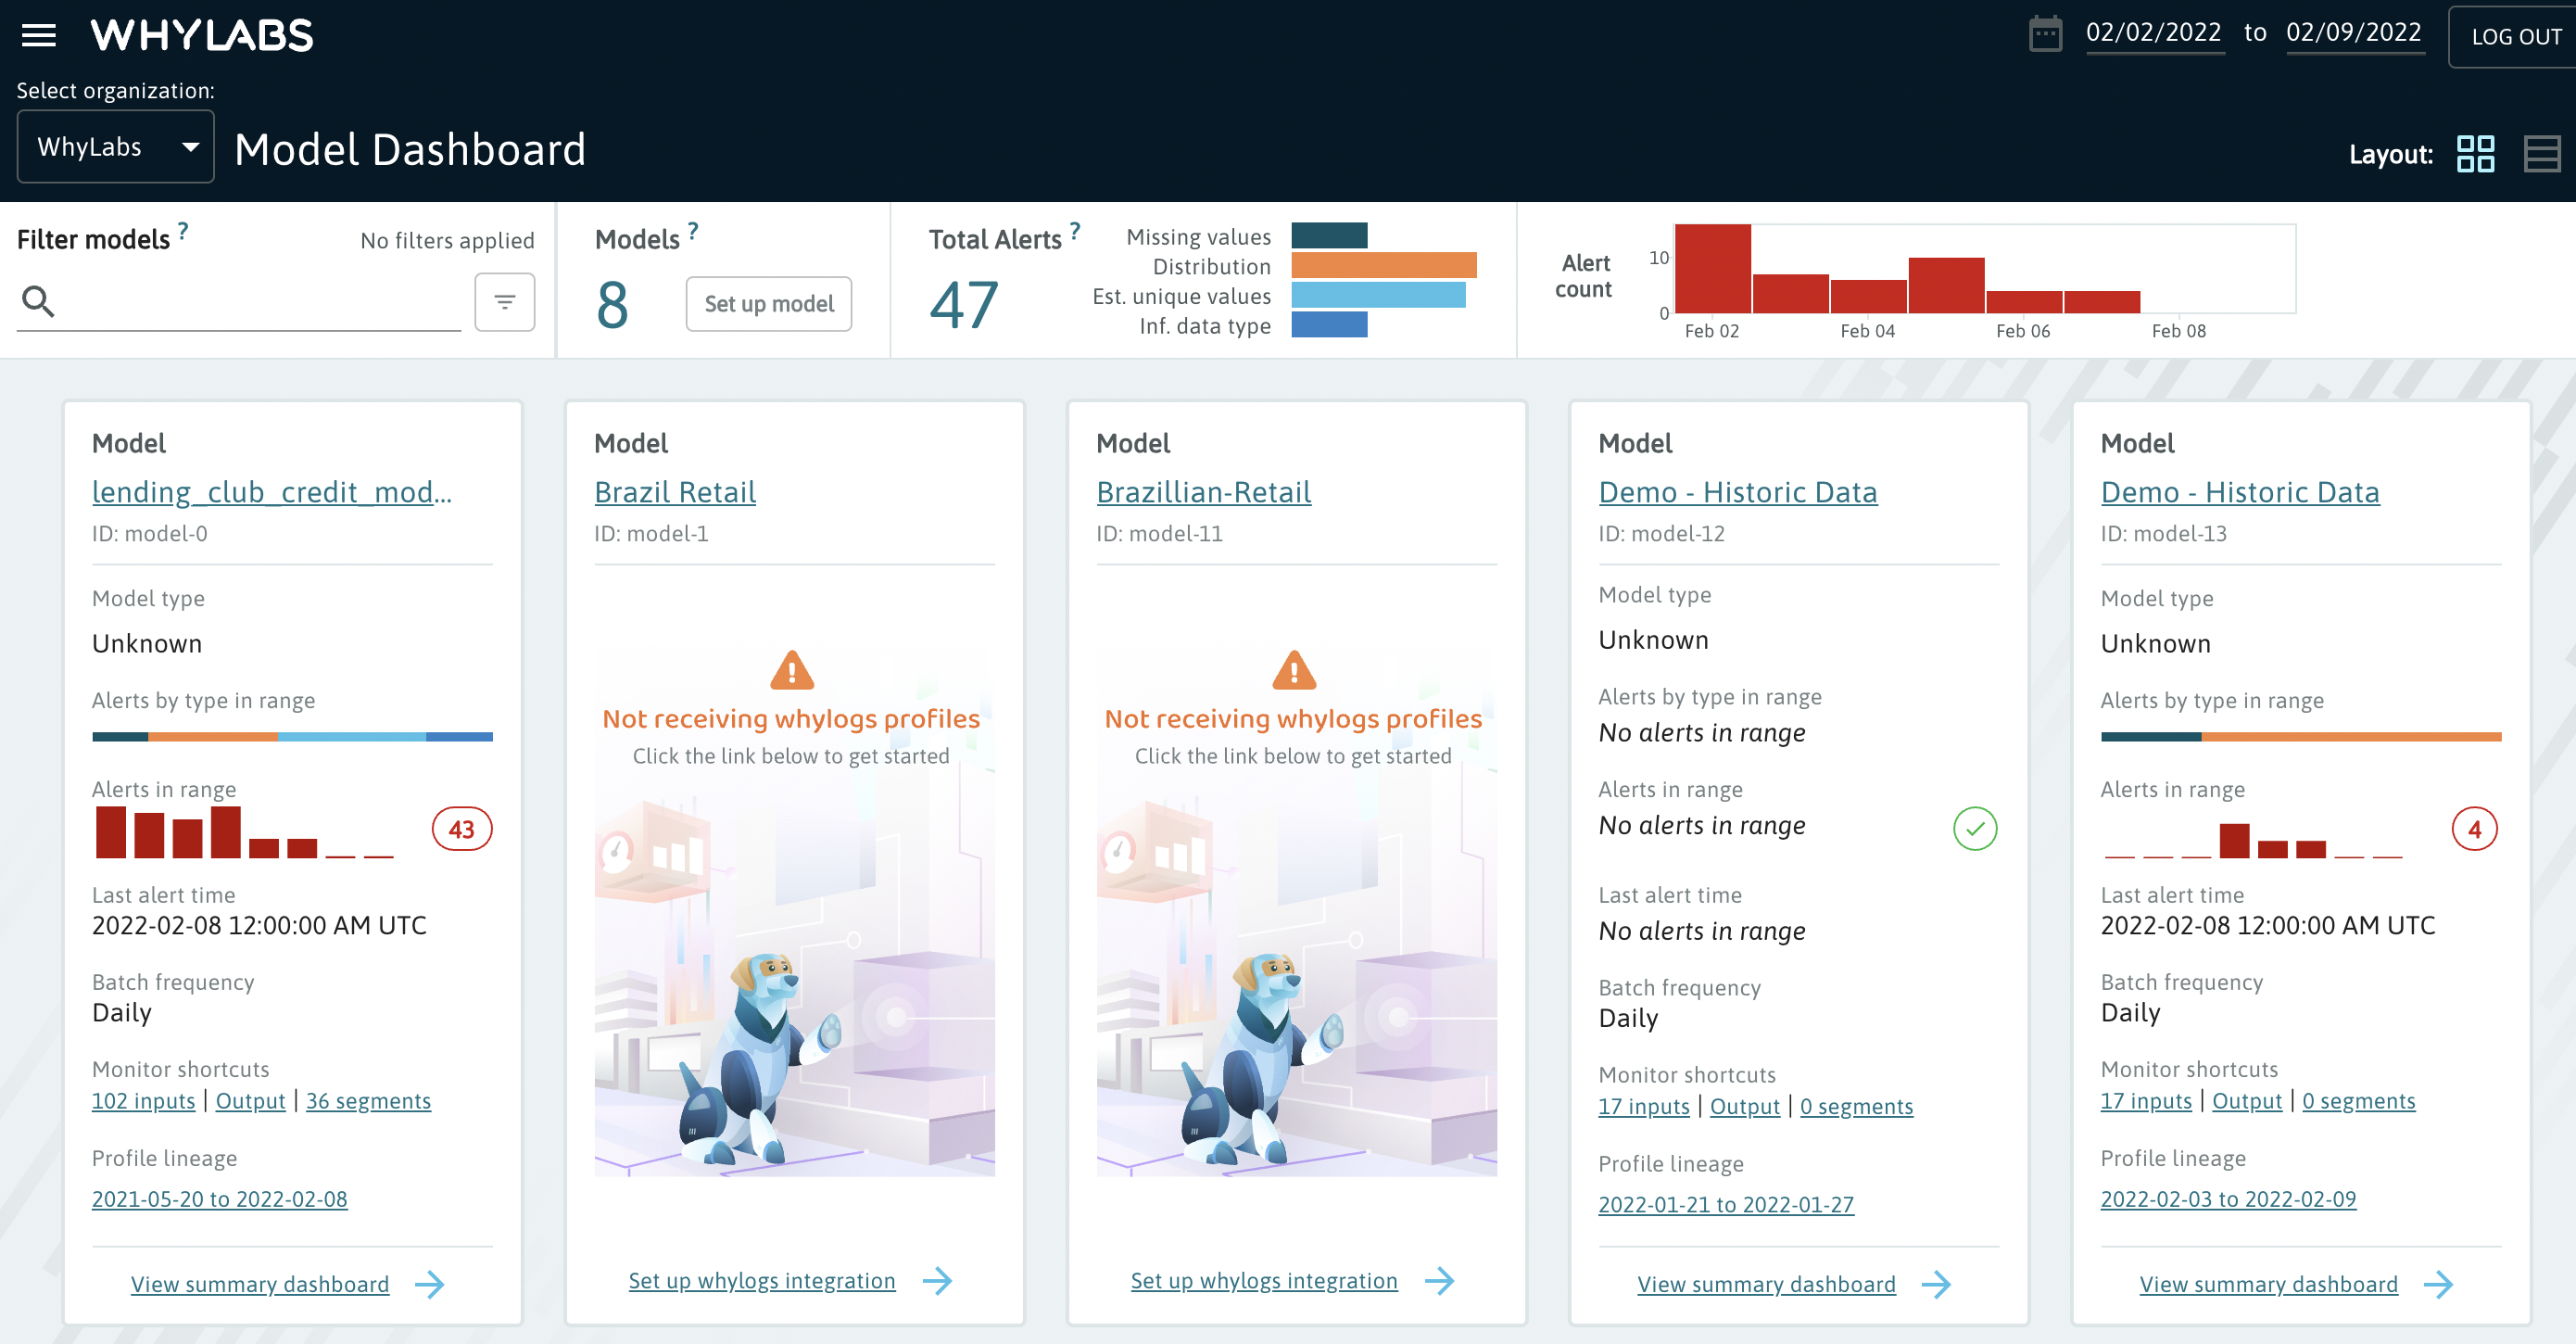
Organization dashboards are time-specific - if you select a specific time range on the top right corner of the app, the dashboard will be configured to the chosen time range. This is very handy for going back in time and focusing on the past week / month / quarter / year to summarize the overall status of all models time-to-date.
Core users of the organization dashboard are team leads and executives. The dashboard allows users to get a 1000-foot view of all models that the organization is currently running in production and a quick overview of their health.
For enterprise team members that are part of multiple organizations, the drop down on the top left of the page will allow you to select a different organization for the dashboard.
Tips: If you have a model that is no longer reporting data, but you would like to zoom into the time period when it did report data, click the link under “Profile lineage” to zoom into that time frame. There are controls for quick renaming and deleting models in the organizational dashboard, making it easy to tidy-up the dashboard. There is a control for quickly creating a new model in the bottom of the dashboard. In the top right corner, there is a link to switch between dashboard view and table view. Table view allows you to filter by model type!
Model Summary Dashboard
The model summary dashboard is the most commonly used page by model owners. This dashboard captures all health data that AI Observatory is tracking for a given model as well as a summary of alerts, notifications, and segments.
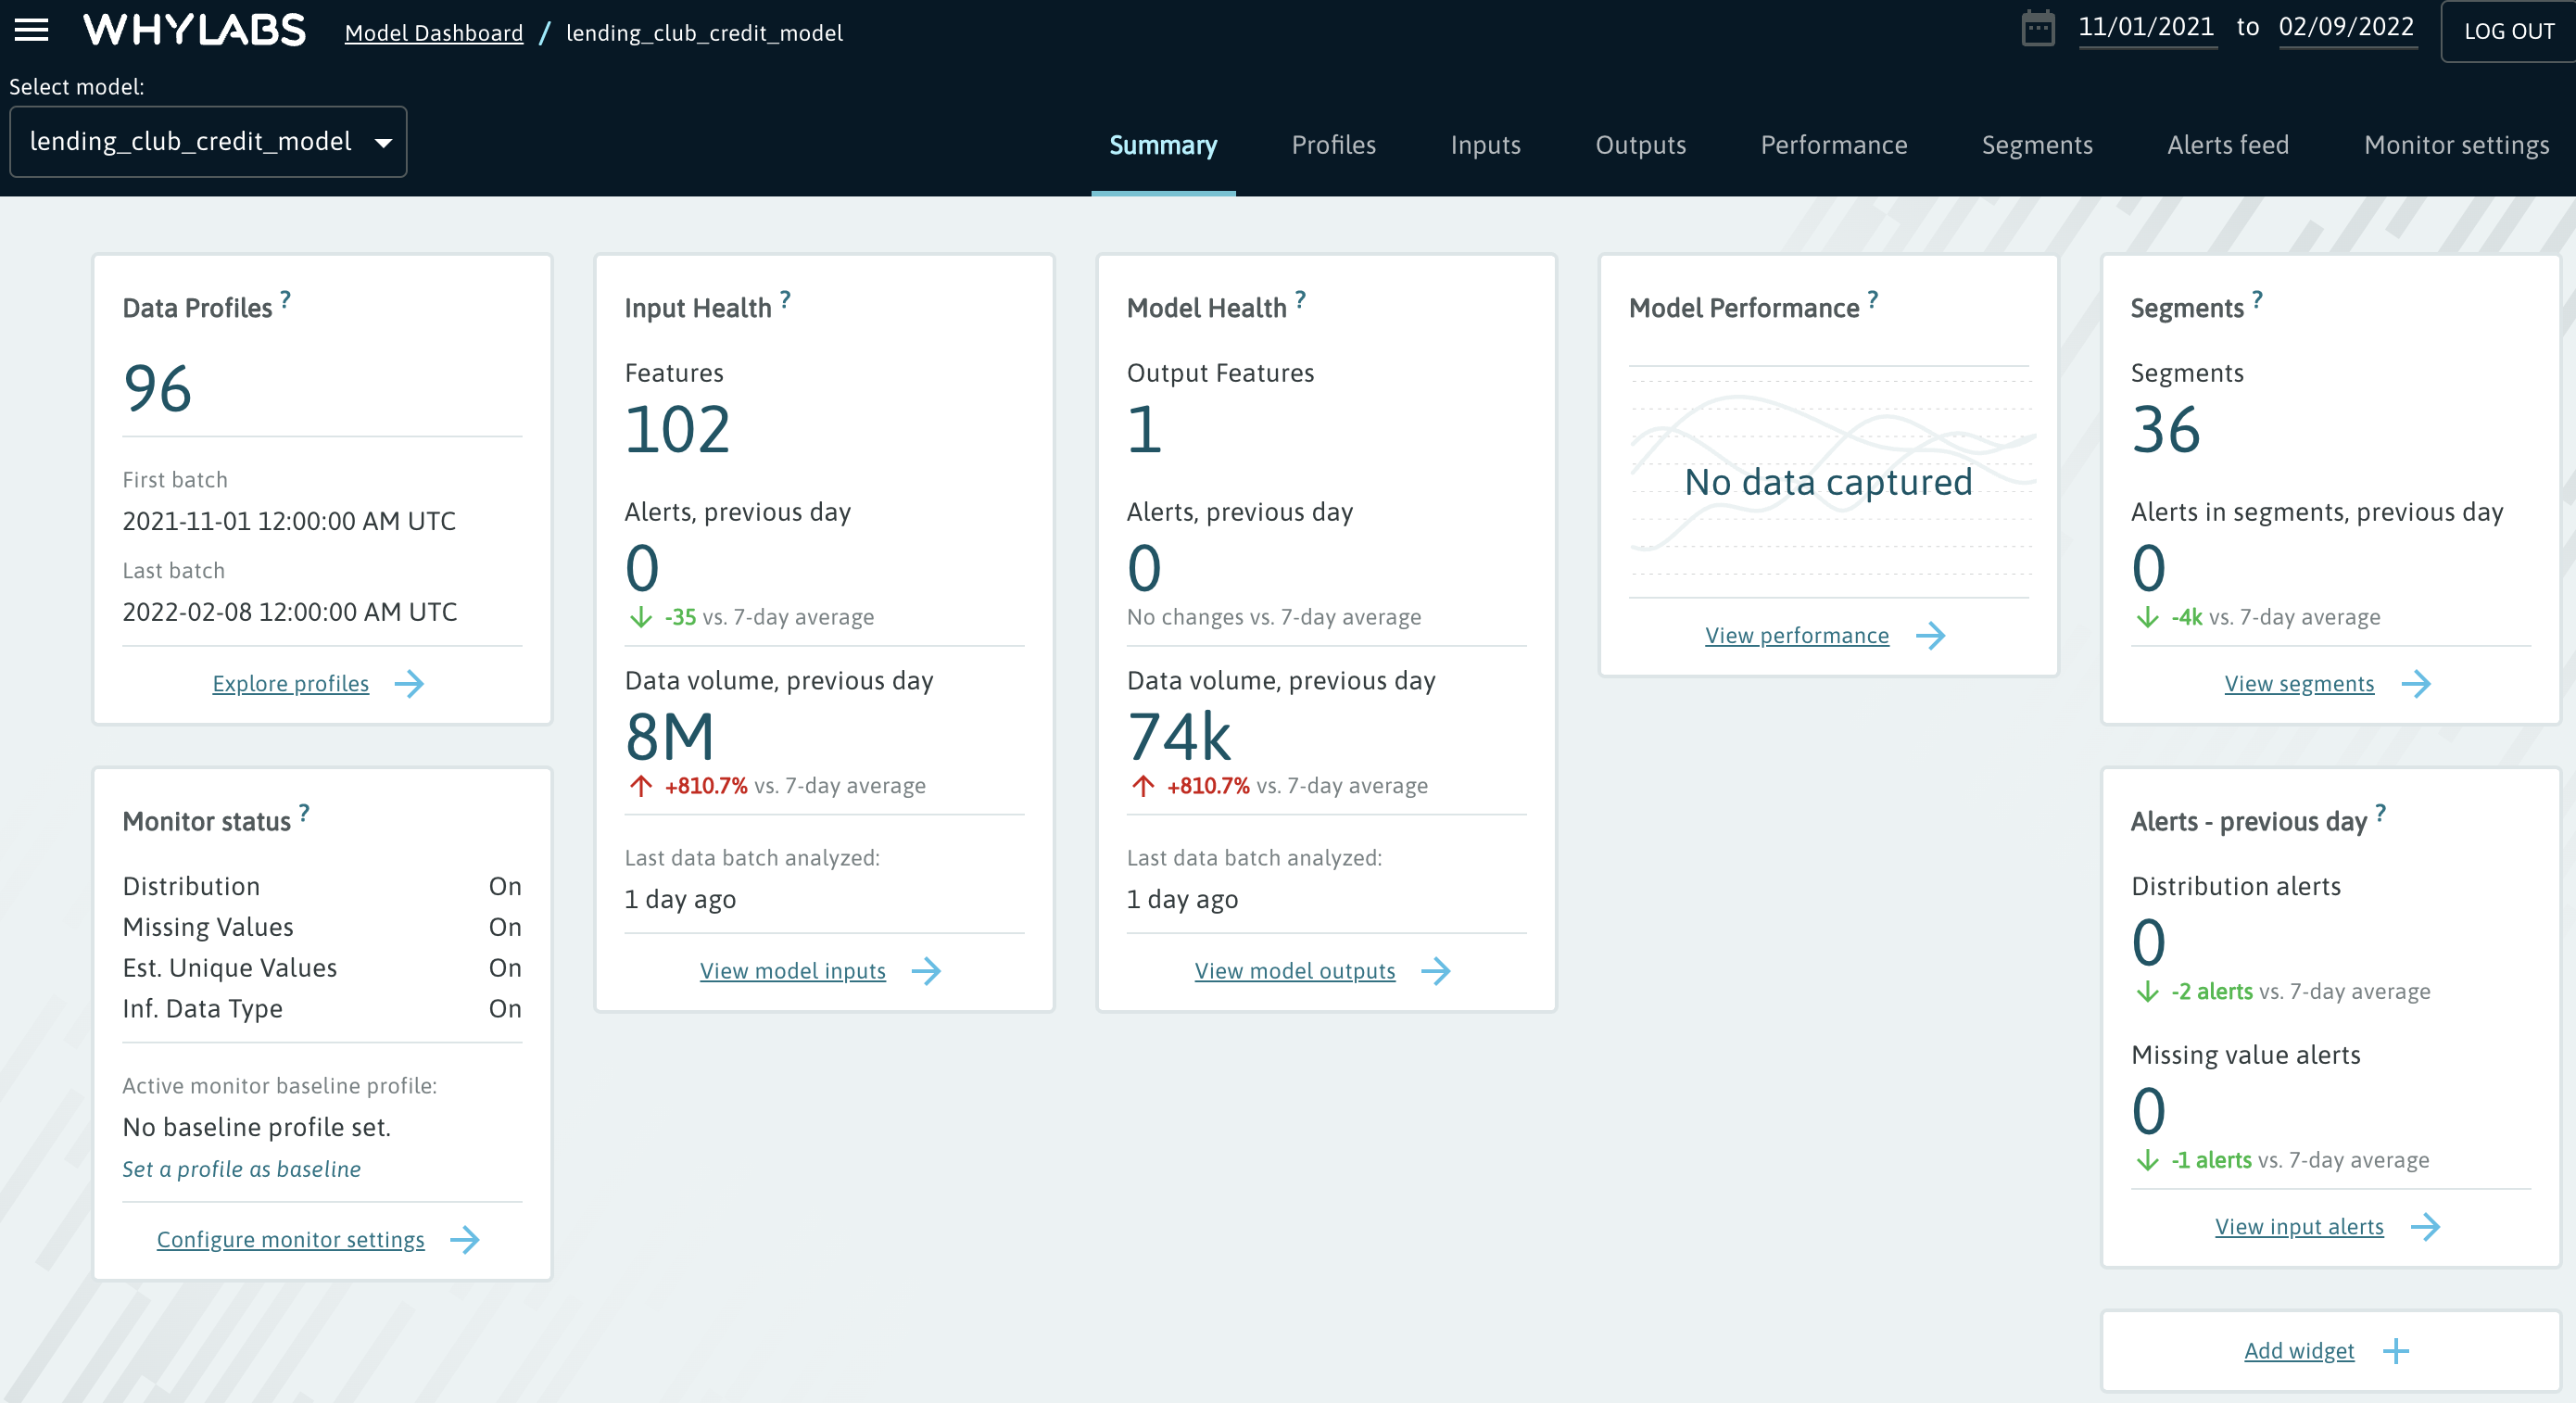
Here are the currently supported widgets: Data profiles: overall summary of profiles that are available to AI Observatory for monitoring Monitoring status: summary of monitoring configurations Input health: summary of model inputs, including the number of features tracked and overall data volume health Output health: summary of model outputs, including the number of output features tracked and overall data volume health Model performance: summary of key model performance metrics Segments: number of segments tracked and summary of alerting over specific segments Alerts: summary of all alerts generated for the specific model
Model summary dashboards are time specific. By default they show the model health over the trailing 7 days. If you also change the time span of this dashboard by changing the range in the top right corner. This feature becomes very useful for weekly and monthly business reviews.
Core users of the model summary dashboard are SREs and data scientists who use AI Observatory bookmark the model summary page, making it easy to incorporate a quick check on model health during the day.
Tips: The dashboard is customizable, you can drag and drop elements to specific places for reporting You can remove certain details from the dashboard for reporting You can get custom widgets for this dashboard, email your customer success manager about a widget that would make your dashboard more actionable/valuable
Performance Dashboards
This dashboard displays all performance metrics that are available to AI Observatory for a specific model. The performance metrics that are available in this model are automatically rendered in the dashboard. Different metrics will be displayed depending on the model type.
Performance dashboards are time specific. By default they show the performance over the trailing 7 days. If you also change the time span of this dashboard by changing the range in the top right corner. This feature becomes very useful for weekly and monthly business reviews.
Core users of the model summary dashboard are data scientists and product managers. Tracking model performance is a core daily activity for any model that has ground truth.
Tips: AI Observatory supports out of the box configurations for common model types: Binary Classifications, Multi-class classification, and Regression. Check out this tutorial for configurations model performance metrics.
Customizing Dashboards
All dashboards in AI Observatory support customization. Furthermore, if you are looking for a dashboard that we don’t currently support, we’d love to make it available to you and other customers. Reach out to your customer success manager with ideas!

